
Applying ALE tables to the material world: an introduction.
You’ll need to be familiar with the concepts of real capital and systems dynamics from previous posts, if you are not already.
The Assets – Liabilities – Equity (ALE) accounting method is a fundamental approach used in financial accounting to record and report the financial position of an organization. It involves the classification and measurement of an organization’s resources (assets), obligations (liabilities), and owners’ interests (equity). This method is widely appreciated by businesses, non-profit organizations, and governmental entities as it provides a comprehensive and transparent overview of an organization’s financial health.
The approach therefore, is favoured by economists advising policy makers. However, not just money, but physical resources – their function, availability, capacity, etc. are vital to the workings of society. This dimension can be lost when looking through an economics-heavy lens. What is needed is the robustness of the ALE method applied to the material world. Let us present it here:
Asset-Liability-Equity (ALE) tables lend themselves to modeling of real capital within the framework of systems dynamics modeling, especially of the material fabric of society. They provide a framework to represent and analyze stocks and flows of non-financial items. That is, real capital, such as natural resources, ( natural capital) energy, or ecosystem services (natural capital), or our infrastructure (built capital) or our institutions (social capital) and citizens (human capital). Here’s how the structure works:
The basic table
| Assets | Liabilities | Equity | Check |
| A | B | A – B=C | A – B – C = 0 |
Columns as Stock
- Definition: Columns in ALE tables represent the stocks, which are static quantities or inventories at a given time. These could include tangible resources like water reserves, mineral deposits, (natural capital) or built infrastructure, (built capital) as well as intangible assets like government policies or knowledge capital (social capital).
- Purpose: Stocks embody the system’s capacity or state. For instance, the stock of forest resources (natural capital) might represent the current availability of timber or carbon sequestration potential. For built capital, built infrastructure can be represented as function and capacity.
Rows as Flows
- Definition: Rows denote flows, which are dynamic changes occurring over time. These include inputs, outputs, or transformations that alter the stocks. Flows could involve material extractions, emissions, or the transition of resources through different stages of a system.
- Purpose: Flows track activities or processes. For example, a row could record annual timber harvested from a forest (outflow) or the rate of reforestation (inflow).
Example Applications

The graph above shows the global carbon cycle in gigatons of carbon. The columns represent the take up/emissions as Assets and Liabilities. An additional Asset column represents the stock of carbon stored at any one time in plants, soil, atmosphere and oceans.
The rows show the flows out of the system ( for example, photosynthesis) and flows into the system (for example, from soil microbial respiration). The table reveals the climate problem from an unusual angle: the stock is larger than the equity, which is the net accumulation in the system of 8 gigatons annually.
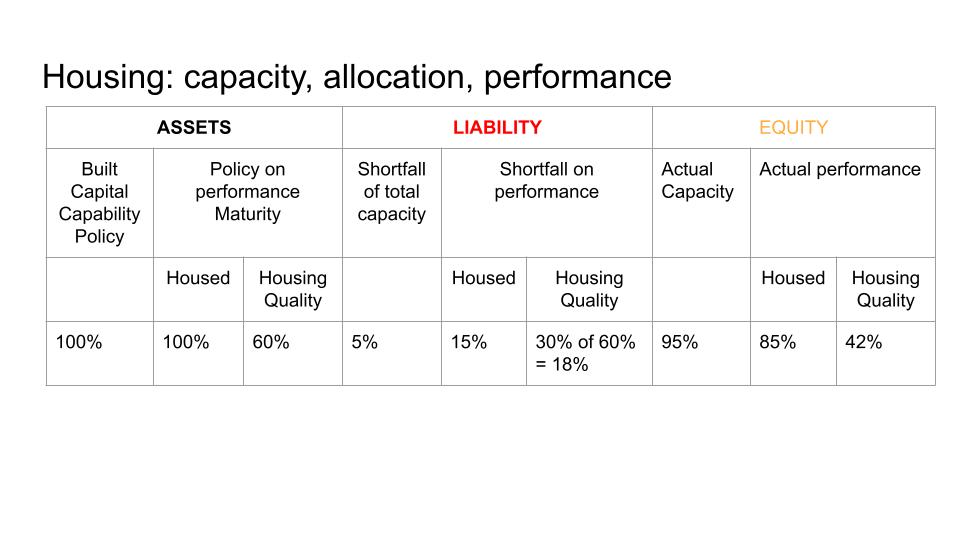
ALE tables can be used to explore allocation and performance. Consider this table, designed for management of housing. It presents current status. A budget or politically approved normative is considered an asset. In this case the asset is a 100% of people housed capability, measured as number of units per potential families. This might be put higher if it is decided that society needs more houses than needed to allow flexibility. Then there is performance. In this case not only should there be enough, but it should be allocated. That is to say, no empty homes or multiple homes held onto whilst others go homeless.
In terms of quality, it is decided that 60% of a given standard is good enough. The liability represents shortfall. Here, there is a 5% shortfall in capacity. The shortfall in allocation, however, is 15%.
The liability for quality is a shortfall of 30% of the accepted standard, which is 18%.
The equity column represents actual capacity and performance, which is 95%, 85% and 42%
Systems Dynamics Perspective
In systems dynamics, ALE tables provide a dual perspective:
- Static Representation: The stocks show the system’s current state.
- Dynamic Processes: The flows reveal how the system evolves over time, helping identify trends, bottlenecks, or opportunities for intervention.
Practical Use Cases
- Sustainability Modeling: Representing the flow of natural resources through different stages of use and regeneration, aiding in sustainable policy formulation.
- Economic-Environmental Integration: Tracking how policy interventions (e.g., carbon taxes) influence stocks of emissions and flows of industrial production.
By linking stocks and flows in this way, ALE tables become a powerful tool for analyzing complex systems, supporting strategic decision-making across economic, environmental, and social domains.

One thought on “Representing Real Capital in Asset Liability Equity tables”