Not in the markets—you won’t see it on a stock ticker. Not in central banks—you won’t hear it in a rate decision. But in the intellectual foundations of the economy itself, a quiet revolt is underway.
For decades, we’ve been told a simple story:
Manage the money supply, and you manage the economy.
Let markets self-organise, and society will benefit.
Pursue growth, and prosperity will trickle down.
That story is now being challenged—not by fringe activists, but by the UN, leading economists, and global research institutions. And in the summer of 2026, three major initiatives landed almost simultaneously, all pointing in the same direction: the economy needs rewriting.
1. The UN’s “Beyond Growth” Roadmap: Growth is Not the Solution
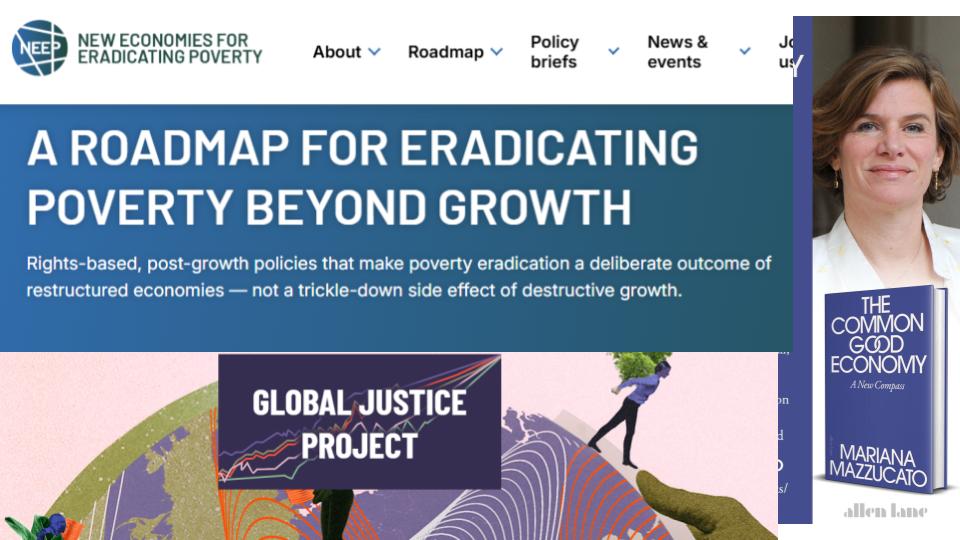
In June 2026, the UN Special Rapporteur on extreme poverty released a striking document: The Roadmap for Eradicating Poverty Beyond Growth.
Its core provocation? Economic growth is no longer a reliable path out of poverty.
The report explicitly rejects the long-held assumption that “growth = progress,” arguing that this belief is now “neither realistic nor sustainable.” [ohchr.org]
Instead, it lays out around 80 policy measures designed to:
reduce inequality,
strengthen public services,
and decouple poverty reduction from GDP growth. [ohchr.org]
The roadmap calls for a“human rights economy”—one that puts well-being and planetary limits at the center, rather than production and consumption. [srpoverty.org]
Even more radical: it argues that our current growth-driven model is actively fueling inequality, weakening democracy, and damaging the planet. [ohchr.org]
This is not tinkering. It is a direct challenge to the idea that markets, left alone, will deliver broad prosperity.
2. The Global Justice Project: Equality First, Not Markets First
Just days earlier, economists associated with the World Inequality Lab launched the Global Justice Report.
If the UN report is a policy roadmap, this is a full-blown alternative economic vision.
Its starting point: We cannot solve climate change, inequality, or instability within the current economic framework.
The report proposes a radical reordering of priorities:
drastic reductions in global inequality,
shorter working hours,
massive redistribution through global wealth taxes,
A fair and sustainable world is possible—but only if inequality is reduced dramatically and systematically. [globaljust….wid.world]
The report also dismisses GDP as the primary measure of success, arguing that prosperity must be measured in terms of well-being within planetary limits. [newsline.com]
This is a frontal assault on the idea that markets, driven by individual self-interest, will naturally converge on the best outcomes.
Instead, it suggests the opposite: unchecked markets produce outcomes incompatible with both democracy and planetary survival.
3. Mariana Mazzucato’s “Common Good Economy”: Markets Must Be Shaped
At the same time, one of the world’s most influential economists, Mariana Mazzucato, is publishing The Common Good Economy (rolling out globally through 2026).
Her argument is as sharp as it is simple: Markets are not natural systems to be managed—they are tools to be designed.
For decades, governments have treated “the good” (public services, environmental protection) as a correction to markets. Mazzucato calls this a trap.
Instead, she proposes:
designing markets around collective goals from the outset,
aligning business, finance, and public policy around shared missions,
She rejects the passive role of government in traditional economics:
The state should not just fix market failures—it should actively shape markets. [hachettebo…kgroup.com]
Her “common good compass” reframes the economy as a purpose-driven system, not a spontaneous outcome of private incentives.
What’s Really Being Challenged
Taken together, these three initiatives form a pattern.
They all reject the same three pillars of old economic thinking:
1. The “invisible hand” is enough
The idea that markets self-organise into efficient and beneficial outcomes—dating back to Adam Smith—is now under heavy criticism. Even modern research suggests markets can be fragile, unstable, and prone to cascading crises. [arxiv.org]
2. Growth fixes everything
The “growth-first” model is being reframed as part of the problem:
it can increase inequality,
degrade ecosystems,
and fail to improve real living conditions for many. [ohchr.org]
3. Managing money equals managing society
Macroeconomic policy—interest rates, inflation, fiscal deficits—has long been seen as the main lever of control. But these new frameworks argue that structure matters more than flows:
Who owns what
Who decides what gets produced
And who benefits from it
A New Economic Imagination Is Emerging
What makes this moment remarkable is not just the ideas themselves, but their convergence.
A UN roadmap
A global inequality research coalition
And a mainstream bestselling economist
…are all saying versions of the same thing:
The economy is not a neutral system. It is a political and social construction—and it must be rebuilt.
The Provocation
Here’s the uncomfortable thought:
What if the traditional economic “common sense” we’ve relied on for 40 years was never neutral science—but a set of assumptions that fit a particular era?
And what if that era—of globalisation, cheap resources, and faith in markets—is ending?
Because if these summer 2026 interventions are right, then the real question is no longer:
The Real Capital Framework, RCF, fits very naturally with the logic of Modern Monetary Theory (MMT). MMT says the binding constraint on public spending is real resources, not money.
RCF does something MMT has often lacked operationally:
It provides a systematic way to measure the condition and availability of real resources before the budget is written.
We are proposing is essentially a Real Capital Pre-Budget Assessment (RCPA).
The foundations of Doughnut economics provide a useful starting point.They require us to identify the social floor of provision of care, (corresponds to the capacity of social capital) as well as the environmental ceiling, of the pressure the economy can bring on natural capital. (Corresponds to the negative performance of built capital owned by social capital)
Below is a structured methodology for testing the approach for the UK, but the principles apply to any country.
The way to test the approach is to go through the method step by step, and pause at each step to see what is learned and if the information from the step informs the purpose of the exerise.
A Real Capital Pre-Budget Assessment Method
For Application in an MMT Policy Framework
1. Purpose of the Exercise
Working Hypothesis:Before a national budget is constructed, the government should understand the state of real capital assets that enable the economy to deliver essential services while staying within ecological limits.
In an MMT framework:
The Real Capital Framework says that it is not resources (which are flows) that are at the heart of the capabilities of an economy, but the real capital(stock), which is
That which is used in the production of goods and services, but not used up
Therefore , the central policy question becomes:
What real capital assets are available, what is their status in terms of capability to fulfil needs, and what is under pressure. Which capital assets are putting negative pressure on other assets?
The assessment aims to identify:
shortages in social provisioning capacity
excessive pressure on natural capital
underdeveloped infrastructure assets
strategic vulnerabilities in key systems
The output is a set of priority investigation areas for the national budget.
2. Conceptual Framework: Real Capital
The analysis treats the economy as a system of interacting capital stocks.
Core categories with examples:
Natural Capital
Infrastructure / Produced Capital
Social Provision Capital
Human Capital
ecosystems soils water systems minerals climate stability
energy systems transport housing industrial capacity water and waste systems
Organisations health systems food systems education care systems housing provision
People Skills Capacity Health
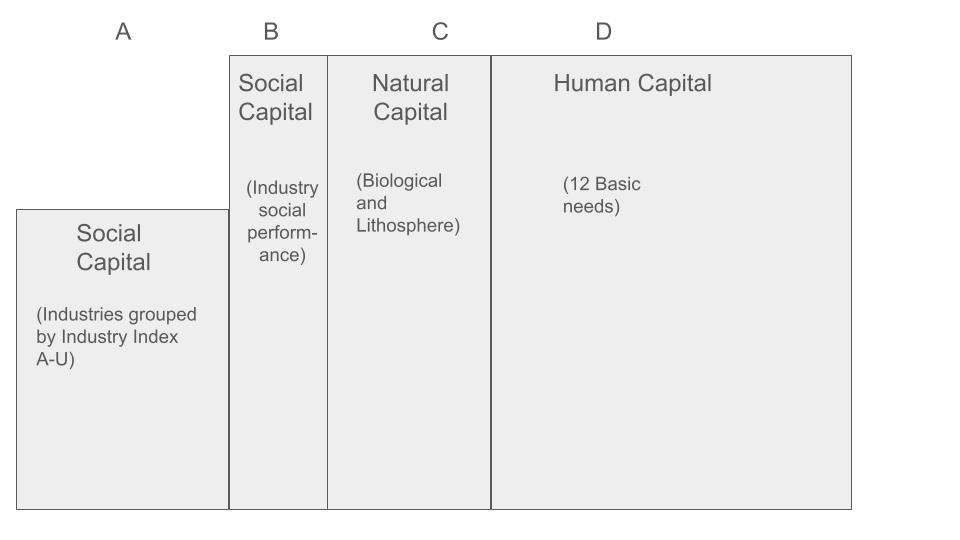
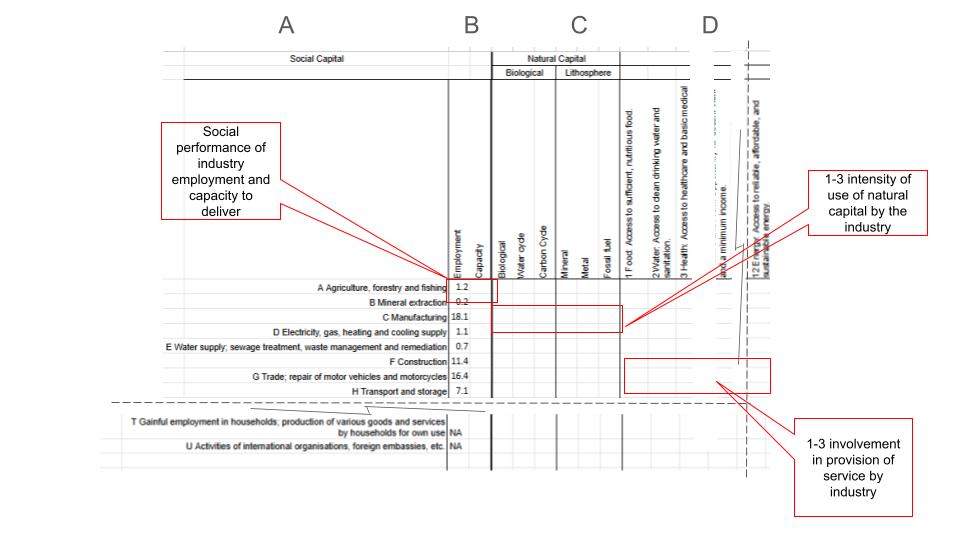
Industries draw on natural capital and infrastructure to deliver social services. The heart of the process is to map industries against human capital and natural capital in a matrix of four main parts.
The diagram above shows the four parts of the matrix. The left column (A) represents the social capital. Here, you can choose the industries – from the SIC classification – under scrutiny.
Column B represents the social performance of these industries. In the example below we use contribution to GDP and contribution to employment.
Column C represents the two types of natural capital, biological and lithosphere. Biological capital includes the main planetary cycles of the planetary boundaries – the water, carbon and nutrient cycles. The lithosphere is a source of real capital, metals and minerals.
The last column represents the providing for essential human needs, we suggest using the ones from Doughnut Economics.
3. Step 1 – Identify Core Social Provision Systems
Begin by defining a small number of essential provisioning needs. This is for section D
Examples for the UK:
Food system
Housing
Energy
Mobility
Health and care
Water and sanitation
These correspond to the social foundation of the Doughnut.
4. Step 2 – Industry Mapping
For each system, identify the industries that enable it, using national industry classifications (i.e., UK SIC). This is section A
Example – Food system:
Agriculture
Fertiliser production
Food manufacturing
Transport and logistics
Retail distribution
Water and waste treatment
This produces a provision map.
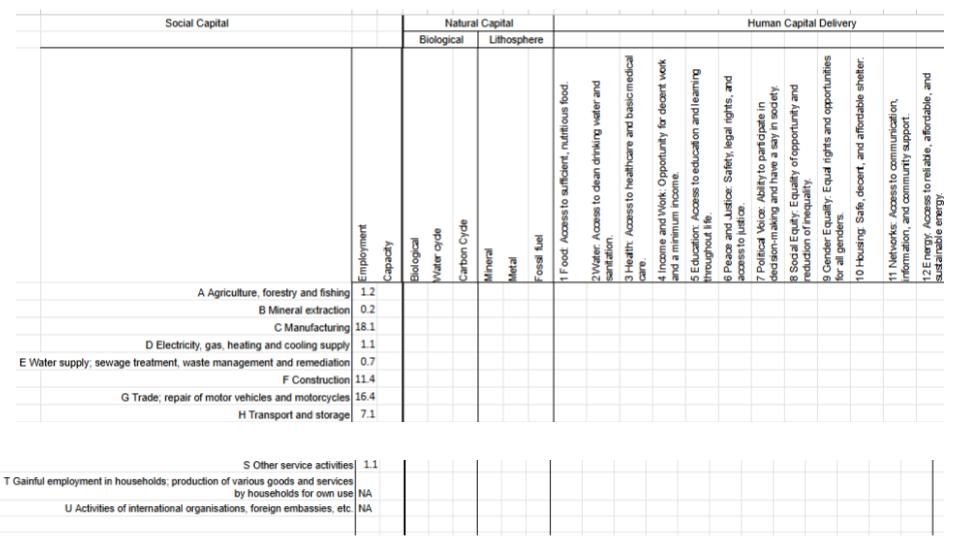
5. Step 3 – Social Provision Matrix
Construct the matrix along the lines of the example above. You can use excel or google sheets or construct a MIRO diagram for collaboration.
Industries × Social Needs
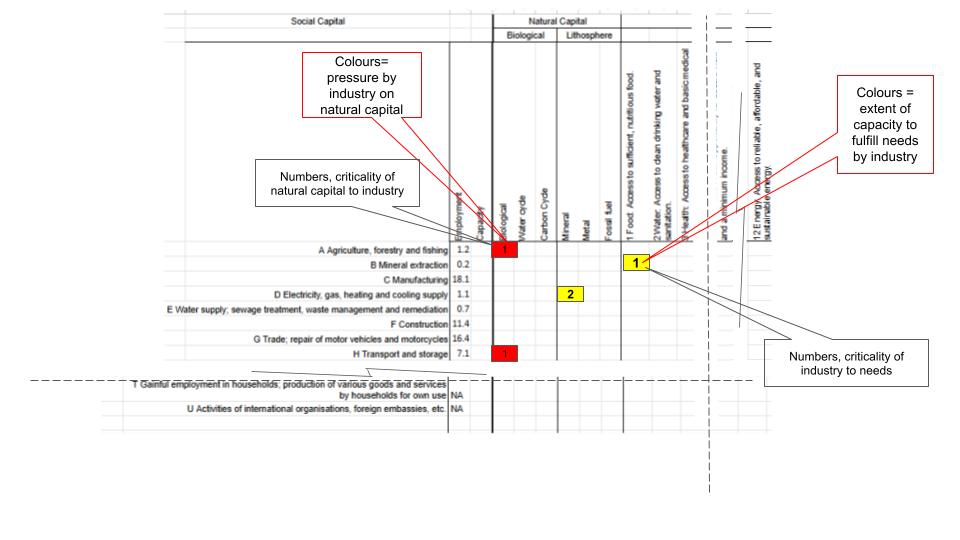
Use a scoring system blank – 3 where 3 means that the industry is the primary provider for the need. Blank means it has no provision.
Diagram shows where add industry importance (D) and industry use of natural capital (C).
For each social need, mark the cells in section D as above.
Then assess each of the industry’s ability to provide. For the numbered cells, colour code them according to capital maturity. Maturity is the extent to which the industry has the capability and capacity to provide for needs. (This is opposed to its current performance, which might be below its capacity.)
Colour coding:
Green – mature capacity Orange – constrained capacity Red – inadequate or fragile capacity
Example indicators might include:
domestic production capacity
workforce availability
infrastructure constraints
affordability or accessibility
This identifies gaps in service provision capability.
6. Step 4 – Natural Capital Pressure Matrix
We now move to section C
Industries × Natural Capital
Natural biological capital may include:
biodiversity / ecosystems
water systems
soils
Lithosphere capital may include:
minerals and materials
fossil fuels
First, identify the extent to which the industry uses the natural capital.
Blank = not at all, 3= to a large extent, the industry is totally reliant on the natural capital. 2 = is moderately reliant and 1 is somewhat. A score of 1 suggests other alternatives exist.
Next, score the industry according to the pressure it puts on the natural capital by colour coding the cell.
Colour coding:
Green – within sustainable limits Orange – approaching limits Red – exceeding sustainable thresholds
This identifies ecological stress points.
7. Step 5 – Identify Capital Immaturity Zones
Overlay the two matrices.
Four cases emerge:
Social Provision
Natural Capital
Interpretation
Green
Green
Mature system
Green
Red
Production with ecological damage
Red
Green
Underdeveloped capacity
Red
Red
Structural crisis
The final category becomes priority sectors for investigation.
The industry performance – contribution to GDP or employment might also inform the nature of the crisis. For example, if an industry has a high impact on biodiversity, but a low GDP contribution is could signal there is little money to make large changes.
8. Step 6 – Deep Dive for Red Areas
For sectors identified as critical, conduct a deeper assessment.
This includes:
identifying the real capital assets involved
analysing constraints on capacity
assessing ecological impacts
identifying missing infrastructure
evaluating workforce and skill availability
Example:
Food system deep dive might examine:
farmland condition
fertiliser supply
nutrient recycling infrastructure
regional food processing capacity
logistics networks
9. Step 7 – Build an Asset Register
For each critical sector, create an asset register aligned with ISO-style asset management principles.
Assets may include:
Infrastructure assets Natural capital assets Production facilities Critical supply systems
For each asset record:
condition
performance
ecological impact
strategic importance
lifecycle status
Note that governments may not own or even operate assets. However, if they are responsible for the running of the economy, and these assets are used, then good management (ISO 55001) demands that they know the factors above.
10. Step 8 – Gap Analysis
Compare the current asset base with the required asset base needed to deliver mature provisioning within ecological limits.
Examples of gaps might include the investment needs as outlined below.
The gaps can be presented in capacity terms, or in functions or in monetary terms, the investment needed to close the gap.
Natural Biological capital
Natural mineral capital
Built Capital
Social capital
Human capital
soil fertility
Aluminum recycling
renewable energy capacity
Technical training colleges
Skilled construction workers
housing construction capacity
11. Step 9 – Lifecycle and Transformation Planning
Using asset management principles, identify:
investments required to restore or expand assets
upgrades needed to reduce ecological pressure
timelines for transformation
This allows estimation of:
investment scale
labour requirements
material requirements
12. Step 10 Capital Gap assessment against budget proposal
Budget
Natural
Built
Social
Human
-Expenditure
+ Firms
+ Benefits +Wages
+ Revenue
-taxes
-taxes
Effects of spending
On environment Metals, fossil reserves, mineral reserves
On built infrastructure like roads, water infrastructure, power generation
On solidity Profits Bankruptcy
on health prosperity economic stress
The table above shows the monetary flows to the types of capital that are in the economic system, namely from Government to ministries to firms, and then to private individuals. These financial entities pay taxes to match the initial expenditure. This economic activity, added to the activity of the private sector has physical effects on the combined real capital of society. This is represented in the bottom line of the table.
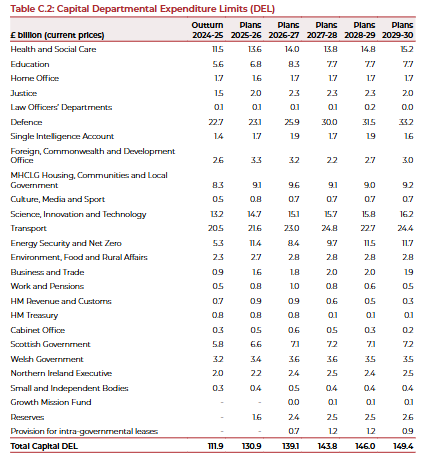
Source; UK Government Budget 2025
The diagram above shows the planned expenditures for the various categories of the UK budget.
Given the estimates of the investment needed for each critical area, it should be possible to estimate the impact of the planned spending on the capital categories involved in the critical areas identified.
ISSUE: XXXXX
Budget item
Natural capital
Mineral capital
Built capital
Social capital
human capital
1
-2
+1
-3
+1
+2
2
1
0
-1
0
-1
3
-3
+1
+3
0
0
….. 26
Sum
-4
+2
-1
+1
-1
According to table above, the budget will have an overall negative effect on the issue.
Step 11 – Input to Budget Formulation
The results feed directly into fiscal policy.
For each priority sector identify:
Real resource requirements
Labour and skills needs
Infrastructure investment
Research and innovation needs
Under MMT principles:
If these real resources exist or can be mobilised, the government has fiscal space to fund the transition.
Budget allocations can therefore be guided by:
closing capital maturity gaps
reducing ecological pressure
strengthening national resilience
13. Outputs of the Process
The pre-budget assessment produces:
A national capital maturity dashboard
A list of priority sectors
A portfolio of critical assets
A quantified investment programme
A roadmap for structural transition
14. Why This Approach Is Useful for MMT
MMT economists often emphasise that:
Money is not the constraint – resources are.
This methodology makes that principle operational by:
mapping real resources directly
identifying where capacity exists
identifying where resources are scarce
highlighting ecological constraints
In other words:
It translates MMT theory into planning practice.
15. Benefits of the Approach
The method:
connects fiscal policy to real economic capacity
integrates ecological limits into planning
reveals hidden structural vulnerabilities
guides investment toward system transformation
supports strategic long-term planning
It also shifts the pre-budget debate from:
“How much money should we spend?”
to:
“What real capital must we build or restore?”
16. How the Exercise Could Be Conducted
For the UK group workshop:
Select two systems (e.g., food and housing)
Construct the two matrices
Identify red areas
Map the relevant assets
Conduct a quick gap analysis
Discuss fiscal implications
Within a few hours the group would see how real capital analysis informs budgeting.
Human Provisioning Systems (HPS) is a proposed scientific and professional discipline dedicated to understanding, designing, and governing how human societies meet fundamental human needs within biophysical and social limits.
Struggling to make policymakers listen? This free manual gives activists and scientists a powerful 11-step toolkit—the Real Capital Framework—to transform frustration into credible, compelling advocacy.
Developed from real-world campaigns in Sweden, this guide shows you how to:
Translate scientific data into clear, targeted demands.
Identify and measure threatened natural, built, social, and human capital.
Hold authorities accountable using their own policies and commitments.
Create one-page briefs and pamphlets that speak the language of decision-makers.
Whether you’re protecting old-growth forests, fighting pollution, or advocating for community health—this framework helps you build a watertight, science-backed case that can’t be ignored.
For decades, our economic discourse has been trapped in a false choice between two unsatisfying futures. On one side stands the familiar model of endless economic growth. This path that relentlessly consumes natural resources and risks environmental devastation. On the other is the alternative of degrowth, a concept often perceived as a narrative of reduction, scarcity, and diminished quality of life. This document introduces a third, more inspiring path forward: the pursuit of Real Capital Maturity. This vision reframes our ultimate economic goal not as perpetual expansion, but as the achievement of a stable, high-quality, and regenerative state where the fundamental needs of everyone are met with sufficiency and efficiency.
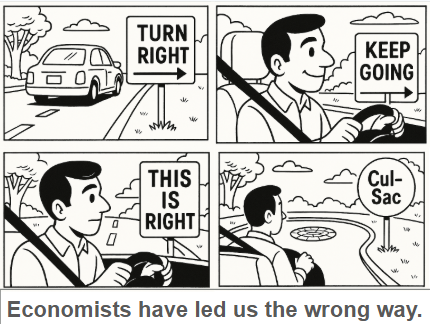
Economists dominate policy making for now, but there might be a way around them
One thing that gets my goat is the way economic thinking – with its stupid ideas about the way people work (maximizers) and the way companies work (increasing marginal costs) and the way nations work (banks lend other people’s money) – pervades policy making. Most politicians seem to have swallowed economics 101. I made it my personal crusade to find ways to get around this disingenuous bunch. I might have found something. Read on.
I understand the appeal. It all comes down to money anyway, why not just manage a nation based on money – as long as it looks like all is under control why worry? But as I point out in my Real Capital Blog, things you want to keep functioning – health, forests, railways, water cycles, metal access – get downgraded to a point where they might collapse.
The alternative is complicated. Say you are a scientist that sees that a city has got 3 years left of groundwater. Your report will probably end up nowhere. The machinery, to get from warning through the engineering, through the companies pumping, through the city administration, through the planning, through the political leadership is so complicated and you would need specialist knowledge in every layer to be taken seriously. Just finding out who is actually responsible for what is months of work. And as a scientist you won’t have a workable alternative.
Or, it USED to be that way. You can now get AI to do all the heavy lifting. I tried it with the Real Capital Framework. Get this: there is nothing new with Real Capital, in all its components, the ideas have been around a while (read accessible to AI). The only trick to getting AI to do the work is to point it in the right direction.
This is where AI prompts come in. If you just get the prompts right, in the right order AI will sail through the spaghetti of causes, responsibilities, effects, etc to produce clear, policy decision basis reporting synthesising dozens of professional domains.
This is what economics should be, and AI can prise the role from the sweaty grasp of economists.
This is a letting my heart out moment and I can’t promise it is going to be coherent. But I see some very important things that have happened recently as stakes in the new ground of economic thinking and in politics. There is a challenge laid down to find something new, built out of the old
Most national budgets tell us how much money governments plan to spend and collect. But they rarely say anything about whether the nation’s forests are thriving, its infrastructure is decaying, or whether citizens are healthy and capable of sustaining the next generation’s wellbeing.
In other words, the budget tracks the money — but not the real foundations of value that the money is meant to mobilize.
That missing link is what the Real Capital Framework was created to address.
The Real Capital Framework (RCF) helps scientists and policy advisors create compelling decision basis reports for policy makers. Using the RCF you will present the science in a way that policy makers will find actionable.
However, there are a lot of groups out there who want to get their message across – citizen advocates, nature protection associations, local community developers etc. So this post is for you. It is early days, though. What follows is the RCF adaptation for testing.