
Fortunately for us, Sweden keeps a pretty comprehensive set of statistics 1 on how its industry performs. It takes a while to retrieve them and put them together at the highest levels, but the exercise reveals som particular insights about how the developed world works. You could say that supply chains represent the workings of the global super organism. When you look at the system from above, you see some glaring disconnects. It gives a good idea of who is doing what to the planet, and who is earning the money from it. They are definitely different industries, if not different people.
This is how it works: firstly, each industry is given a letter A-T where T is work done in the household. The table below shows the letters and the various industries. From the initial letter category you can drill down to a numerical classification of industry in detail. When you register your company you need to designate it in the relevant area or areas.
For brevity and the purposes of this exercise, the service categories, I-T are put together as they have very little material impact. The exception is logistics and transport, H.

This ABC of industry is set up so that you can identify the whole supply chain, rather like the way the organs in a body work. You could say that this approach gives us an insight into the way the global economy, as a super-organism works, when you draw it out like the diagram below.

The diagram shows the start of the process at the bottom (harvest and extraction from nature), to the end (consumption by households and recycling).
The circular economy would replenish the stocks that supply the system – by returning minerals to a stock, and by replenishing natural systems.
There are some key aspects of how this “superorganism” works that are key for understanding.
Products
Each industry type produces products, represented by the dark green arrows, that are passed on to the next industry until the products /services are used up by households. This must be the main “artery” of the superorganism and supply chain, from raw material to product to waste, or in the case of the circular economy, to be recycled.
Infrastructure
There is a very important category of product to notice, represented by the red lines. This is infrastructure. That is something that is for example, tools, manufacturing machinery or transport vehicles, to be used by other industries to refine and transport the products to get to the final consumer. These are often referred to as built capital. This built capital represents the capability of the super organism to perform, both in terms of circularity and capacity. For example, if all the machines used in the supply chains can only run on fossil fuel, then the system is driving climate heating.
The role of energy
Energy flow is represented by the blue line. Energy (Industry D-heat, electricity etc.) comes partly from burning extracted materials, so the extractive industries (A and B) supply the energy industry which themselves need energy to supply the other industries. Some energy comes from recycled materials.
Material and recycling
The dotted lines show recycling between the manufacturing and distribution steps (E to CF, GH, I-T) as well as energy to D.
Routes to the circular economy
This sketch of how things work shows quite clearly that for the economy to work in a circular way, all extracted mineral material that is not in use should end up in stocks to be re-used. Indeed it should be kept in use as long as possible once the enormous effort to extract it has been done.
For natural, biological material, the source – natural ecosystems – should be regenerated and replenished. In fact, there is a simple principle involved.
If you take it and use it, you must ensure you put it back or regenerate the capacity to produce as least as much as you took.
PHILOSOPHIA OECONOMIA CIRCULARIS PRINCIPIA NATURALIA
Industry performance in GDP and environmental impact varies
That might not be as easy as it sounds. To understand why, we can look at figures that reflect how the system works, rather like the way a doctor might look at vital signs.
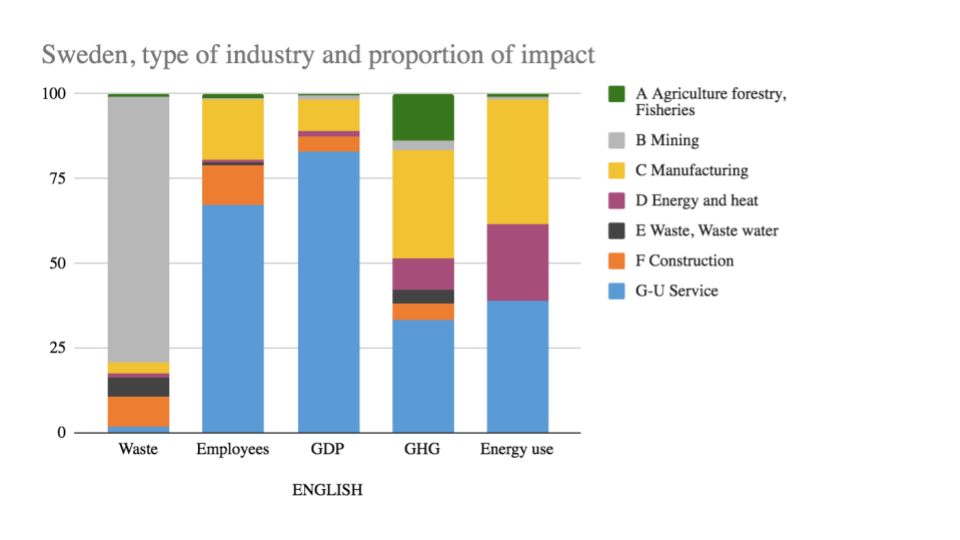
The diagram above shows key performance figures – waste, employees, GDP, Greenhouse gasses (GHG) and energy use – as percentages of the whole – for each of the industrial categories.
The main contributor to employment and GDP are the service industries, represented in blue, whereas the main contributors to waste are mining and construction. This shows us the major disconnect when it comes to transitioning to circularity. Those industries that benefit most from extracted and harvested materials, that give most benefit to people via employment, are those that are disconnected from the circular return of that material. That is to say, these industries have the people and the money to ensure circularity. The extractive industries, A &B, have by comparison tiny shares of GDP and employees. Even if they wanted to, without the money and staff from the other industries they do not have the resources to transition to circularity.
Construction (F, in orange) and manufacturing (C yellow) have smaller contributions to GDP whilst being responsible for a good proportion of energy use (manufacturing) and waste (construction). The same disconnect applies here. Industries are benefitting from large proportions of GDP whilst other industries are not making the money that would be needed to invest in infrastructure to reduce energy and waste.
Indeed, when you look with the eyes of the circular economy at the basics:
- Food: from field to table back to field
- Water: from rain to purification back to surface water
- Housing: from forest to timber, from quarry to stone to house to another house back to stocks of materials
You see that the circular supply, if redesigned, could be done better with less energy and materials.
The simple truths: the industries that could pay for circularity are not doing that
These are simple truths. The service industries are benefitting disproportionately from those industries which are exerting large ecological footprints on Earth systems. And they are not doing anything about it because they don’t have to.
The system needs a redesign, where policy needs to be re-crafted to ensure that those industries that extract and emit greenhouse gasses, are given the responsibility to replace and regenerate. Manufacturing of products should ensure they can stay in the economy much longer – with repair and refurbishment – and not be egged on by the retail industry to shorten product life-time. And those industries that create welfare with employment and GDP should be tasked with staffing and financing the extractive industries so they can fulfil their role of creating stocks and nature regeneration.
References
The Statistics are publicly available and come from the Swedish agencies for statistics, energy and nature protection. They are from 2021.

3 thoughts on “The ABC of Supply Chains shows the disconnects killing the planet”