
This year, 2025, is the year Swedish local authorities are tasked with preparing for the Green Revolution: To make sure the Paris agreements are reached, to fulfill EU directives on nature, AND to prepare for shocks from the ever-increasing weather volatility.

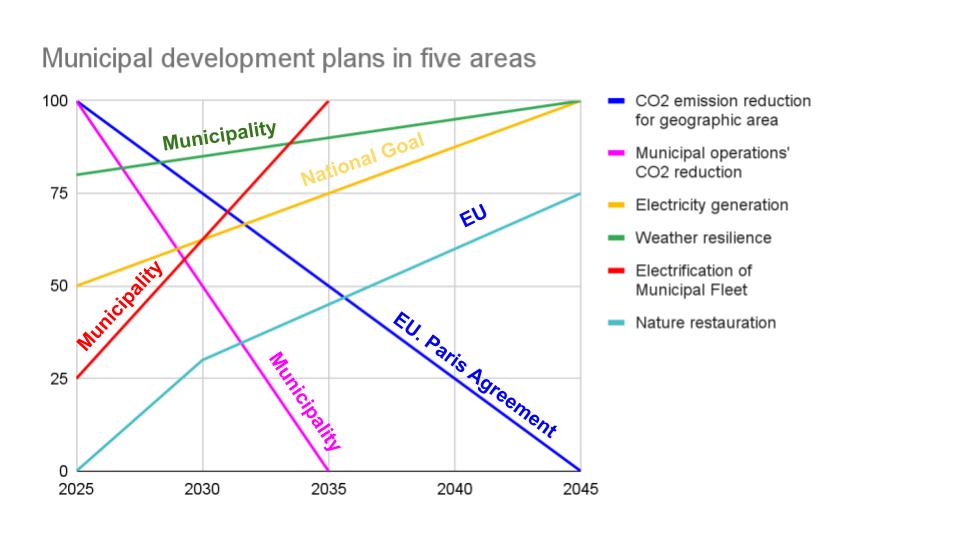
As a local politician, I am involved in the preparations. To share some of the more theoretical challenges I prepared this chart below. This is my own interpretation, by plotting the changes as a simple straight line from now to then. It shows the challenges most municipalities in the EU face. At the bottom is the time line, and the vertical axis represents the percentage change over the time period.
Looking at the graph certainly raises some questions, and calls for comment. But first let us get into the details of the graph:
Here are the various transitions in more detail:
CO2 emission reduction for geographic area
The aim is for the municipal geographic area to be net zero by 2045. This is mapped as going from 100 today, (which represents CO2 emissions from fossil burning 2024), to zero in 2045. This is a national goal, based on Sweden’s Paris commitment.
Municipal operations’ CO2 reduction
Again this is mapped as going from 100 today, (which represents CO2 emissions from fossil burning 2024), to zero in 2035. This is a municipal goal.
Electricity generation
The aim is to double electricity generation by 2045. This is represented as 100% in 2045 (as meeting 100 of demand expected) to 50% in 2024. (That is to say the generation today meets 50% of expected 2045 demand). A municipal goal, based on electricity demand from de-fossilization.
Weather resilience
Let us assume that 20% of buildings are considered vulnerable. This has to be addressed to 2045. This is a municipal goal based on Weather Authorities predictions of extreme weather.
Electrification of Municipal Fleet
The current electrification is around 25%. So to meet the need for municipal operations to be net zero, we represent the transition from 80% meeting demand today to 100% in 2035.
Nature restoration
According to the EU nature restoration directive: the overarching objective is to restore 20% of EU’s degraded ecosystems by 2030 and all by 2050. This is represented as 0% fulfilled today, to 100% by 2050 with the waypoint 30% by 2030.
We have a framework of normatives
So what do I mean by normative? Normative is the expression of the way something should be. In this case, looking at the reductions/increases over time plotted above, it is the changes that should be made if we are to fulfill the demands of the various goals set. (You could imagine another mathematical treatment of this but let’s stick to the straight line for the moment.)
Questions: is it trackable:
We took this question up earlier around municipal indicators. Here we have six major changes that should happen relatively fast. Of course, local politicians need to be able to gain an understanding of how the changes are progressing. Not least as it will be their responsibility to introduce measures to correct developments that are outside the agreed trajectory.
As local politicians are laymen and part-time, the indicators chosen need to be as simple as possible, but not simplistic.. It might be OK to have an indicator that does not cover the whole aspect completely, but gives a general direction of movement.
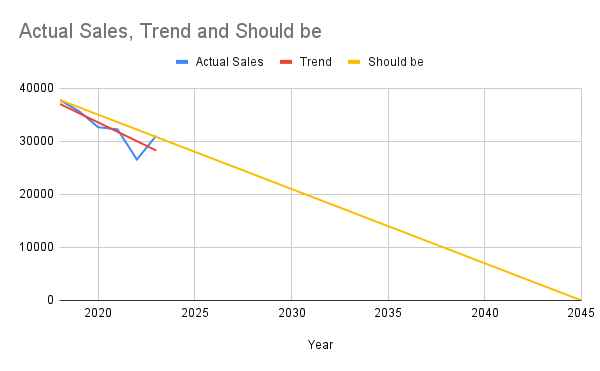
The advantage of the straight line approach is that is would allow politicians to see that if the actual result is under the line, the transition is on track. The example below shows the fossil fuel sales in the municipality against the trajectory to fulfill Sweden’s Paris commitments.
This might be sufficient for politicians. Another approach is to try gauges. In this case, 100% is “should be” and the dial shows the gap. The dial shows green when sales are under, and yellow/green when it is over.
The gauges come from the equation:
Progress = 100 X Status now/Should be
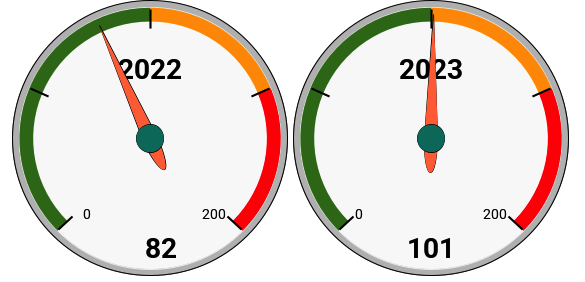
In this case there needs to be a value judgment as to what is green, yellow and red. Possibly, everything over trajectory could be red.
Question: what sort of measures would be considered “good for getting to the goal”
Mathis Wackernagel the founder of ecological footprint, suggests that every measure you introduce that reduces the need for others is a good one.
For example, introducing electric vehicles reduces the overall energy demand of the transport system as they are more effective. Keeping trees in the town reduces the risk for overheating in the buildings shaded by them. Bus routes to shopping centers reduce car transport needs for shopping.
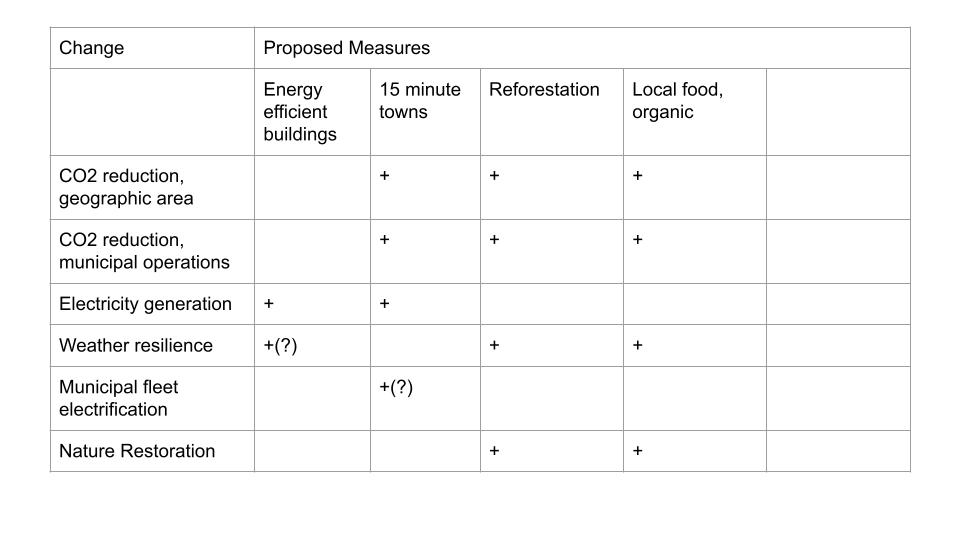
The table below illustrates this approach, where the possible measure is mapped against the change needed.
A thought experiment
The table above shows four possible measures. How might they affect the six areas of change?
CO2 reduction for geographical area
Fifteen minute towns would reduce transport needs, and thereby reduce the demand for fossil-powered vehicles. Reforestation, as part of nature restoration would take up more CO2 and contribute to net zero. Local food would mean less transport, and together with 15 minute towns contribute to reducing the need for fossil-powered transport.
CO2 reduction for municipal operations
Again, the arguments above are valid for the municipal net zero goals.
Doubling Electricity Generation
Reducing the energy demand of buildings means there is more energy over for other uses. Decreasing electricity demand would make the increase in electricity production easier. Transport accounts for about 25% of all energy needs. Therefore, 15 minute towns and local food would contribute. We should bear in mind that electrification of vehicles reduces the overall energy demand for transport. Electric vehicles are far more efficient.
Increasing weather resistance of the built environment
It might be that insulated buildings can better withstand extremes of heat and cold. However, that does not help with floods. Reforestation would help, even more trees in urban areas provide shade, and forests help against flooding. Where extreme weather events in other parts of the world threaten food supplies, local food provides security. Relying too much on local food would be problematic, however, when extreme weather affects the area itself.
All vehicles (and machinery) in the municipal fleet changed to electric
This contributes to the net zero goals. It might be that localising food production and creating 15 minute towns means that other, lighter and less demanding municipal fleet could be envisaged.
Nature restoration
Organic farming entails restoring ecological function to the local ecosystem, and reforestation could be done in a way to encourage the biodiversity goals of the EU program.
Question: is it doable?
Not without a lot of money to spend on new technology. And there is so much that has been put off that now has to happen over 9 years.
One conclusion to draw from the above thought experiment is that different measures contribute in different ways to the goals. Co-ordination at municipal level is essential to find the best combinations and synergies.
Question:If it is not doable, what kind of strategy can local authorities have?
I would say one that builds a culture of taking care of each other, enjoying life and preparing communities to solve the challenges together, rather than just relying on the municipality or corporations.
What do you think?
