
Short Communication
Stephen Hinton, Fellow, International Association of Advanced Materials
ABSTRACT
Supply chains are international. To be effective, it follows that actors should use a common language with the same vocabulary, metrics etc. in each country to be able to run, monitor and regulate them. They have a common grammar that embodies key generally accepted concepts. This grammar, however, still reflects the make-take-dispose mental models of the linear economy. This report presents a proposal for a description of supply chain grammar using the Swedish SNI categorisation of industries. The proposal models supply chains with sufficient granularity to allow identification of intervention points for the crafting of policy to stimulate the transition to circularity.
Each installed production device in the various types of the chain can be classified according to their capability for circularity, allowing for quantitative measures to help companies and countries craft policy and strategy.
Introduction
The circular economy, envisaged early on (Reday-Mulvey, 1977) as the economy of loops, was seen primarily as a way to handle material shortages. Later on, circularity was seen as being a way to reduce energy demand as extraction and new manufacture are both large energy users (Braungart 2009). Recently, countries like Sweden (Swedish Government, 2020) saw the circular economy as a pathway to transitioning to renewable energy and renewable materials as the basis of prosperity.
But how can we know how circular a society is? Research has been done into how much material is recycled – that is material that is sold as waste, but reclassified as raw material. This is based on the take-make-dispose linear thinking. A good example of this approach is the circular material use rate in Europe.
Another approach is to design the product for circularity (Moreno 2016). Another is to take a product centred approach and look at its impact using a Life Cycle Assessment – LCA (Garia-Gusano, 2014).
This is important work, but does not shed light on the actual workings of the supply chain and its potential. A comprehensive understanding about how current supply chains work will be essential for the decision basis prepared for policy development. The policy that will stimulate the transition to circularity. A policy basis that, for example, for essential products and services, identifies what the level of capability for circularity is now and its potential? Where in the supply chain are interventions needed?
To address some of these questions, a robust model of supply chains is needed, a model that lends itself to statistical analysis as well as system dynamics. The questions of availability of supply and equitable allocation need to be addressed too.
Instead of remaining with the take-make- dispose (recycle) model, adapting it to take-make -use( Elisha,2020) or the standard Supply Chain Reference Model, we propose viewing the supply chain as a kind of technological super organism that has evolved with its set of specialized organs.
Supply chain entity classification: SNI
To start with, fortunately, international standards exist where all companies are classified according to their role in the supply chain. Statistics are collected using these classifications. The supply chain model below uses the highest level classifications from the Swedish system, SNI (Statistics Sweden) as a starting point.
Main categories of supply chain entities
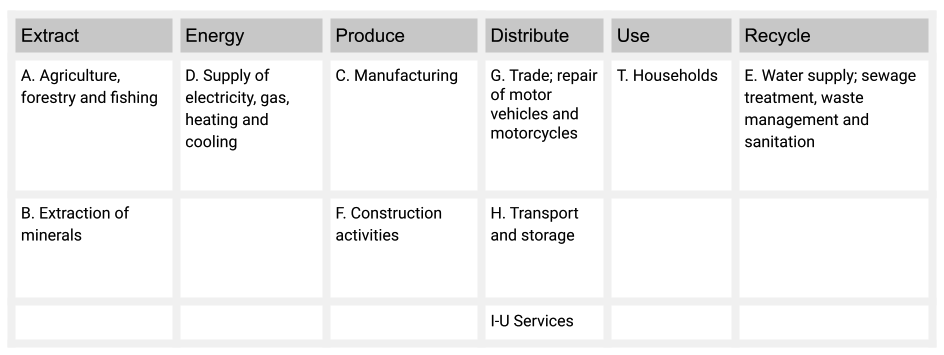
The table below shows the SNI categories (A-U) categorised under the six main steps of supply chains.
Modeling supply chains to accommodate SNI classification.
The diagram below gives an overview of the circular economy with the flows between each of the actor categories. At the bottom, mineral stocks (reserves in the ground) are extracted to enter the economy along with biological material which is harvested from ecosystems.
After use in products and infrastructure, the mineral materials remain in the economy in the form of stocks (for example, scrap metal) and the biological material is returned to recipients like water bodies or used to replenish ecosystems via composting, for example.
Current technology and practices produce waste. Waste is material in a state such that the economy perceives no use for it. In effect it leaves the economy.

Fig (1) generic supply chain diagram
The diagram above gives a generic view over the various steps in the supply chain. After extraction, raw materials are processed into materials for production. The produced products (thick arrows) are distributed, used by consumers and recycled. Each step involves infrastructure – machines, tools, installations, etc. This infrastructure (red line) never reaches consumers, but is produced for the other actors in the supply chain.
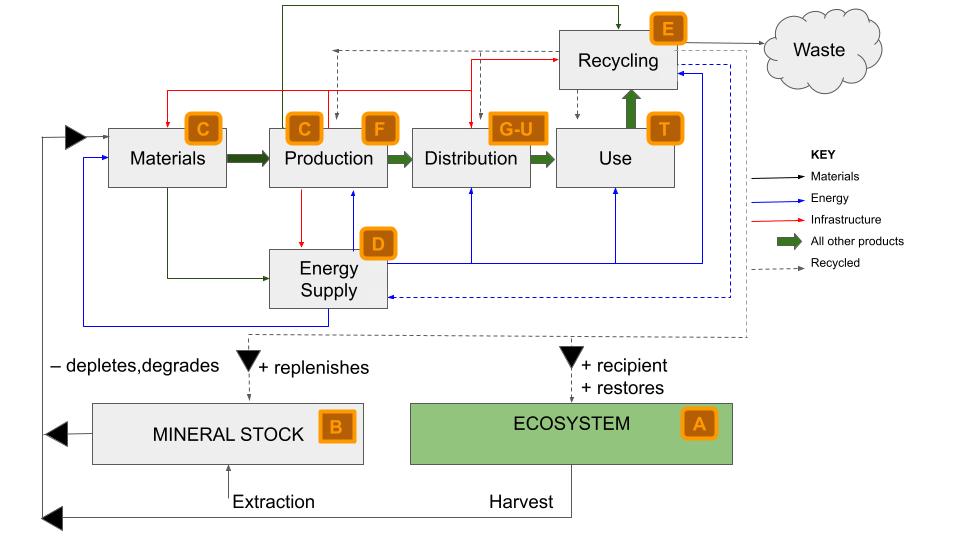
The diagram above gives a more nuanced picture of supply chains related to the main SNI categories.
A, Agriculture, Fishing and Forestry
From a supply chain viewpoint, the function of (A) is to harvest biomaterial and deliver to manufacturing (C ) which includes food processing. This harvesting obviously risks depleting ecosystems, so a return of organic nutrients and biological material from (E) is essential.
B, Mining
Mining extracts from the lithosphere materials which, unlike biological material of (A) are not renewable. The supply of materials to manufacturing demands that they be returned to manufacturing after use from (E). And mining is extremely destructive of the physical environment and produces a lot of waste that is not easily recycled. One special case of mined materials is oil, shale and tar oil, coal and gas. Unlike metals, these are not recyclable once the energy stored in them is spent.
C Manufacturing.
Materials flow to Production, of products ( C ) manufacturing and to built infrastructure, construction (F). Recycling from (E) should return material to stocks in (C ) and (F).
The manufacturing sector produces two main types of products: those for consumer use and those used in the other sectors. (D,E,F,A,B,) as well as in its own sector,( C).
D Energy supply
Both biomaterial and lithosphere sourced fossil fuels are burnt to produce energy. Material from Waste handling as well as waste from production and distribution are burnt to produce energy. Note the red line from production to energy, representing energy production infrastructure from (C )
E Water and Waste management including water, sanitation and sewage
Waste from all other supply chain functions is processed in this industrial category. For categorisation purposes, water purification and supply is included.
F Construction
Everyone needs houses and roads. Buildings are part of the backbone of our way of life. The construction industry produces this infrastructure from materials and products from C and waste flows to E. At the same time, waste from construction can be converted to energy in D. Conversely, D provides energy for construction.
G-S, U Manufactured goods become part of retail or the services sector. The transport sector, H, is important to keep in mind as it is one of the largest emitters of greenhouse gasses.
The Households sector is the magnet that pulls energy, materials and then products through the supply chains.It is the sector that produces household waste for processing in E whilst being a consumer of water from E.
The capability of installed infrastructure to handle materials
The environmental and circular performance of the supply chain is determined by the capacity of this infrastructure. Infrastructure is another form of real capital, built capital.
The main bulk of material processing takes place in the material production (A) and production (C ) stages. There are, however, some steps in the other stages, like transport in the distribution stage, that require large C material inputs of fossil fuel. The following general criteria apply:
The capability of the infrastructure to
- Run on renewable energy
- Use recycled inputs
- Produce recyclable waste, even at the recycling stage
- Produce long-lasting, repairable products
In some cases, the installed infrastructure capability may be one hundred percent. In other cases, where a certain process requires high quality inputs, the capability may be zero.
Capability and performance of the installed supply chain technology base
Capability is one thing, but performance is another. For example, the installed base of manufacturing machines may run on electricity. In theory all electricity can be produced from renewable resources so capacity is one hundred percent. However, if fifty percent of the electricity is generated from fossil sources, the actual performance is fifty percent. Furthermore, it may well be that some operations require machines that only run on fossil fuel and no current alternatives exist. This is true for some mining equipment and forestry equipment, for example.
Companies rarely use all of the installed production capability, for various reasons. These include managing the risk of not being able to fulfill orders, and the preparedness for sudden increase in orders.
Finally, for research and development strategy development, BAT – best available technology- is important. It may be that firms are using old infrastructure when new equipment is capable of handling advanced materials in a circular way, for example. To understand this better, and to explore how to communicate the capability of installed infrastructure, the information can be presented in terms of Assets, Liabilities and Equity.
The stated aim is seen as an asset to the industry, the shortfall a liability and the difference, Assets Minus Liability, (ALE) the actual value of the infrastructure in terms of circularity, the Equity.
In accounting, each row of the table must conform to Assets-Liabilities = Equity. Or A-L-E =0
To illustrate this reasoning, the table below represents the infrastructure of a fictitious industry. In some aspects, like recyclable waste, the industry has a high capability. In other aspects, like product lifetime, capability is low.
| GOAL: Circular economy, Industry (x) | |||||||
| ASSETS | LIABILITIES | EQUITY | |||||
| Policy Aim | Capability shortfall | BAT Shortfall | Performance Shortfall | Capability | Performance | Current BAT | |
| Fossil-Free energy | 100% | 30% | 8% | 10% | 70% | 60% | 92% |
| Recycled inputs | 100% | 20% | 15% | 30% | 80% | 50% | 85% |
| Recyclable waste | 100% | 10% | 5% | 50% | 90% | 40% | 95% |
| Product Lifetime | 100% | 80% | 70% | 5% | 20% | 15% | 30% |
Table (1): ALE table over Industry circularity capability and performance
This data can be presented in an even clearer way using stacked column charts. As the diagram below shows, there are variations between BAT, capability, and actual performance.

Graph (1): Capability and performance of industry (X) – Illustrative. 100% = policy aim.
Using this fictive example as an illustration – if the aim is for one hundred percent fossil-free energy, then strategy should aim to encourage improvement of BAT and a transition to BAT. For recyclable inputs the focus should be on realising capacity and improving BAT. The main challenge for recyclable waste is capacity realisation, whereas lifetime needs research and development to increase product lifetime.
Installed infrastructure capability addresses the question: if we are to introduce the circular economy, what capabilities in the supply chain are material to circularity?In this case, the manufacturing infrastructure needs to be upgraded to comply with circular demands: to run on renewable energy, recycled material, to produce no net emissions, to produce only recyclable waste and to produce long-life, repairable products.
Allocation
If minerals and natural materials are in short supply, policy must determine who, or which function should be prioritised. This can apply to the budget for CO2 emissions, too, where the circular economy includes a circular and balanced carbon cycle – specifically to meet the Paris accord. Which factors are material to short supply can also be analysed from the point of view of which industries use the material, how much and what for.
The graph below (of a fictive situation) illustrates a comparison between three companies, who all supply the same product. It compares the proportion of fuel supply they use against the number of customers. Clearly, B uses less fuel to supply a comparatively larger number, and C uses more fuel for fewer.

Summary
For the circular economy to become a reality, supply chains cannot be simply seen as companies linked in a chain of economic processes leading to the customer’s needs being satisfied. Circularity entails more factors being material to circular policy, including Built Capital’s function, capability and use..
By modelling the supply chain from the standpoint of the nine types of actors, each representing a stock of functions and capabilities, scientists and consultants will be able to provide better decision bases for policy development. This entails presenting the information to policy makers in a clear Asset -Liability -Equity Framework, and using system dynamics modelling.
Availability of materials, priority of their uses and rates of material reserve drawdown will inform the need for replenishment through recycling or introduction of alternative approaches. All of these can be modelled over time to allow policy makers to explore various scenarios.
References
Braungart, M., & McDonough, W. (2009). Cradle to cradle. Random House
Elisha, O. D. (2020). Moving beyond take-make-dispose to take-make-use for sustainable economy. Int. J. Sci. Res. Educ, 13(3), 497-516.
García-Gusano, D. (2014). Long-term analysis of the Spanish environmental policies using the life cycle assessment method and energy optimisation modelling. https://doi.org/10.13140/RG.2.1.3649.2328
Meadows, D., & Randers, J. (2012). The limits to growth: the 30-year update. Routledge.
Moreno, M., De los Rios, C., Rowe, Z., & Charnley, F. (2016). A conceptual framework for circular design. Sustainability, 8(9), 937.
Reday-Mulvey, G. (1977). The potential for substituting manpower for energy: Final report 30 July 1977 for the Commission of the European Communities. Battelle, Geneva Research Centre.
Statistics Sweden Swedish Standard Industrial Classification https://snisok.scb.se/en
Swedish Government 2020: Cirkulär ekonomi – Strategi för omställning i Sverige
