
The Real Capital Framework, RCF, fits very naturally with the logic of Modern Monetary Theory (MMT).
MMT says the binding constraint on public spending is real resources, not money.
RCF does something MMT has often lacked operationally:
It provides a systematic way to measure the condition and availability of real resources before the budget is written.
We are proposing is essentially a Real Capital Pre-Budget Assessment (RCPA).
The foundations of Doughnut economics provide a useful starting point.They require us to identify the social floor of provision of care, (corresponds to the capacity of social capital) as well as the environmental ceiling, of the pressure the economy can bring on natural capital. (Corresponds to the negative performance of built capital owned by social capital)
Below is a structured methodology for testing the approach for the UK, but the principles apply to any country.
The way to test the approach is to go through the method step by step, and pause at each step to see what is learned and if the information from the step informs the purpose of the exerise.
A Real Capital Pre-Budget Assessment Method
For Application in an MMT Policy Framework
1. Purpose of the Exercise
Working Hypothesis:Before a national budget is constructed, the government should understand the state of real capital assets that enable the economy to deliver essential services while staying within ecological limits.
In an MMT framework:
The Real Capital Framework says that it is not resources (which are flows) that are at the heart of the capabilities of an economy, but the real capital(stock), which is
That which is used in the production of goods and services, but not used up
Therefore , the central policy question becomes:
What real capital assets are available, what is their status in terms of capability to fulfil needs, and what is under pressure. Which capital assets are putting negative pressure on other assets?
The assessment aims to identify:
- shortages in social provisioning capacity
- excessive pressure on natural capital
- underdeveloped infrastructure assets
- strategic vulnerabilities in key systems
The output is a set of priority investigation areas for the national budget.
2. Conceptual Framework: Real Capital
The analysis treats the economy as a system of interacting capital stocks.
Core categories with examples:
| Natural Capital | Infrastructure / Produced Capital | Social Provision Capital | Human Capital |
| ecosystems soils water systems minerals climate stability | energy systems transport housing industrial capacity water and waste systems | Organisations health systems food systems education care systems housing provision | People Skills Capacity Health |
Industries draw on natural capital and infrastructure to deliver social services. The heart of the process is to map industries against human capital and natural capital in a matrix of four main parts.
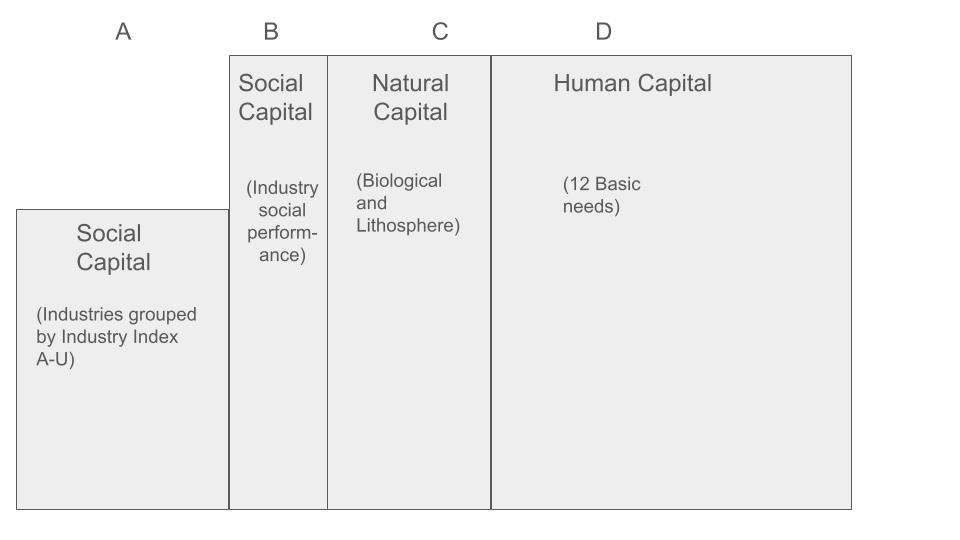
The diagram above shows the four parts of the matrix. The left column (A) represents the social capital. Here, you can choose the industries – from the SIC classification – under scrutiny.
Column B represents the social performance of these industries. In the example below we use contribution to GDP and contribution to employment.
Column C represents the two types of natural capital, biological and lithosphere. Biological capital includes the main planetary cycles of the planetary boundaries – the water, carbon and nutrient cycles. The lithosphere is a source of real capital, metals and minerals.
The last column represents the providing for essential human needs, we suggest using the ones from Doughnut Economics.
3. Step 1 – Identify Core Social Provision Systems
Begin by defining a small number of essential provisioning needs. This is for section D
Examples for the UK:
- Food system
- Housing
- Energy
- Mobility
- Health and care
- Water and sanitation
These correspond to the social foundation of the Doughnut.
4. Step 2 – Industry Mapping
For each system, identify the industries that enable it, using national industry classifications (i.e., UK SIC). This is section A
Example – Food system:
- Agriculture
- Fertiliser production
- Food manufacturing
- Transport and logistics
- Retail distribution
- Water and waste treatment
This produces a provision map.
5. Step 3 – Social Provision Matrix
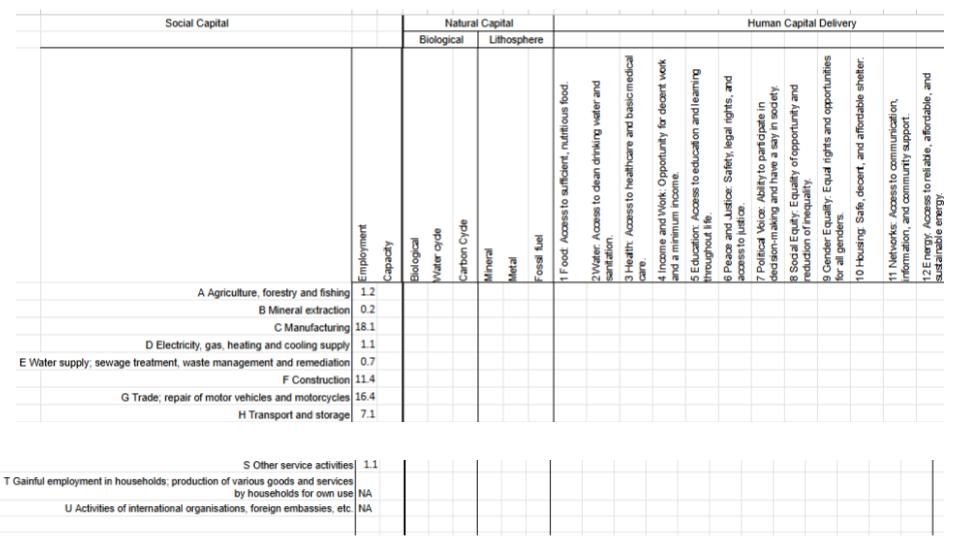
Construct the matrix along the lines of the example above. You can use excel or google sheets or construct a MIRO diagram for collaboration.
Industries × Social Needs
Use a scoring system blank – 3 where 3 means that the industry is the primary provider for the need. Blank means it has no provision.
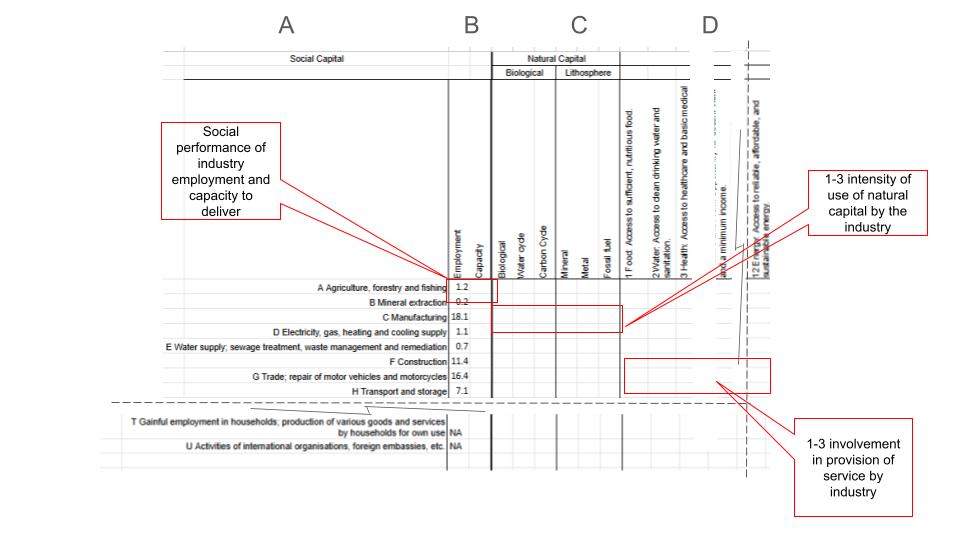
For each social need, mark the cells in section D as above.
Then assess each of the industry’s ability to provide. For the numbered cells, colour code them according to capital maturity. Maturity is the extent to which the industry has the capability and capacity to provide for needs. (This is opposed to its current performance, which might be below its capacity.)
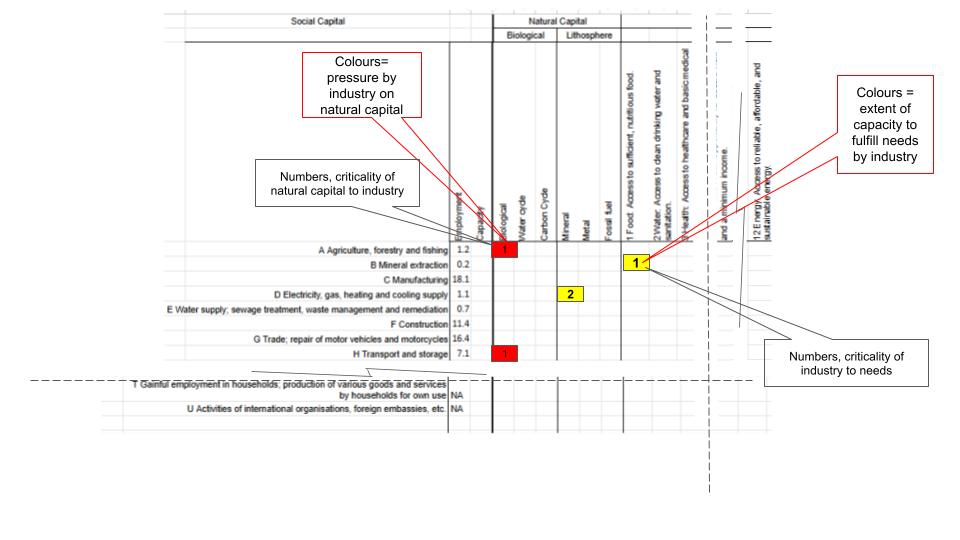
Colour coding:
Green – mature capacity
Orange – constrained capacity
Red – inadequate or fragile capacity
Example indicators might include:
- domestic production capacity
- workforce availability
- infrastructure constraints
- affordability or accessibility
This identifies gaps in service provision capability.
6. Step 4 – Natural Capital Pressure Matrix
We now move to section C
Industries × Natural Capital
Natural biological capital may include:
- biodiversity / ecosystems
- water systems
- soils
Lithosphere capital may include:
- minerals and materials
- fossil fuels
First, identify the extent to which the industry uses the natural capital.
Blank = not at all, 3= to a large extent, the industry is totally reliant on the natural capital. 2 = is moderately reliant and 1 is somewhat. A score of 1 suggests other alternatives exist.
Next, score the industry according to the pressure it puts on the natural capital by colour coding the cell.
Colour coding:
Green – within sustainable limits
Orange – approaching limits
Red – exceeding sustainable thresholds
This identifies ecological stress points.
7. Step 5 – Identify Capital Immaturity Zones
Overlay the two matrices.
Four cases emerge:
| Social Provision | Natural Capital | Interpretation |
|---|---|---|
| Green | Green | Mature system |
| Green | Red | Production with ecological damage |
| Red | Green | Underdeveloped capacity |
| Red | Red | Structural crisis |
The final category becomes priority sectors for investigation.
The industry performance – contribution to GDP or employment might also inform the nature of the crisis. For example, if an industry has a high impact on biodiversity, but a low GDP contribution is could signal there is little money to make large changes.
8. Step 6 – Deep Dive for Red Areas
For sectors identified as critical, conduct a deeper assessment.
This includes:
- identifying the real capital assets involved
- analysing constraints on capacity
- assessing ecological impacts
- identifying missing infrastructure
- evaluating workforce and skill availability
Example:
Food system deep dive might examine:
- farmland condition
- fertiliser supply
- nutrient recycling infrastructure
- regional food processing capacity
- logistics networks
9. Step 7 – Build an Asset Register
For each critical sector, create an asset register aligned with ISO-style asset management principles.
Assets may include:
Infrastructure assets
Natural capital assets
Production facilities
Critical supply systems
For each asset record:
- condition
- performance
- ecological impact
- strategic importance
- lifecycle status
Note that governments may not own or even operate assets. However, if they are responsible for the running of the economy, and these assets are used, then good management (ISO 55001) demands that they know the factors above.
10. Step 8 – Gap Analysis
Compare the current asset base with the required asset base needed to deliver mature provisioning within ecological limits.
Examples of gaps might include the investment needs as outlined below.
The gaps can be presented in capacity terms, or in functions or in monetary terms, the investment needed to close the gap.
| Natural Biological capital | Natural mineral capital | Built Capital | Social capital | Human capital |
| soil fertility | Aluminum recycling | renewable energy capacity | Technical training colleges | Skilled construction workers |
| housing construction capacity |
11. Step 9 – Lifecycle and Transformation Planning
Using asset management principles, identify:
- investments required to restore or expand assets
- upgrades needed to reduce ecological pressure
- timelines for transformation
This allows estimation of:
- investment scale
- labour requirements
- material requirements
12. Step 10 Capital Gap assessment against budget proposal
| Budget | Natural | Built | Social | Human |
| -Expenditure | + Firms | + Benefits +Wages | ||
| + Revenue | -taxes | -taxes | ||
| Effects of spending | On environment Metals, fossil reserves, mineral reserves | On built infrastructure like roads, water infrastructure, power generation | On solidity Profits Bankruptcy | on health prosperity economic stress |
The table above shows the monetary flows to the types of capital that are in the economic system, namely from Government to ministries to firms, and then to private individuals. These financial entities pay taxes to match the initial expenditure. This economic activity, added to the activity of the private sector has physical effects on the combined real capital of society. This is represented in the bottom line of the table.
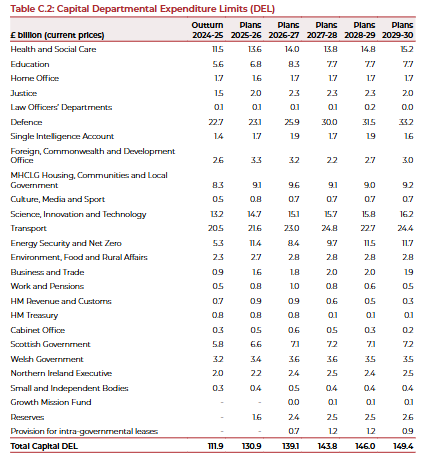
The diagram above shows the planned expenditures for the various categories of the UK budget.
Given the estimates of the investment needed for each critical area, it should be possible to estimate the impact of the planned spending on the capital categories involved in the critical areas identified.
ISSUE: XXXXX
| Budget item | Natural capital | Mineral capital | Built capital | Social capital | human capital |
| 1 | -2 | +1 | -3 | +1 | +2 |
| 2 | 1 | 0 | -1 | 0 | -1 |
| 3 | -3 | +1 | +3 | 0 | 0 |
| ….. 26 | |||||
| Sum | -4 | +2 | -1 | +1 | -1 |
According to table above, the budget will have an overall negative effect on the issue.
Step 11 – Input to Budget Formulation
The results feed directly into fiscal policy.
For each priority sector identify:
- Real resource requirements
- Labour and skills needs
- Infrastructure investment
- Research and innovation needs
Under MMT principles:
If these real resources exist or can be mobilised,
the government has fiscal space to fund the transition.
Budget allocations can therefore be guided by:
- closing capital maturity gaps
- reducing ecological pressure
- strengthening national resilience
13. Outputs of the Process
The pre-budget assessment produces:
- A national capital maturity dashboard
- A list of priority sectors
- A portfolio of critical assets
- A quantified investment programme
- A roadmap for structural transition
14. Why This Approach Is Useful for MMT
MMT economists often emphasise that:
Money is not the constraint – resources are.
This methodology makes that principle operational by:
- mapping real resources directly
- identifying where capacity exists
- identifying where resources are scarce
- highlighting ecological constraints
In other words:
It translates MMT theory into planning practice.
15. Benefits of the Approach
The method:
- connects fiscal policy to real economic capacity
- integrates ecological limits into planning
- reveals hidden structural vulnerabilities
- guides investment toward system transformation
- supports strategic long-term planning
It also shifts the pre-budget debate from:
“How much money should we spend?”
to:
“What real capital must we build or restore?”
16. How the Exercise Could Be Conducted
For the UK group workshop:
- Select two systems (e.g., food and housing)
- Construct the two matrices
- Identify red areas
- Map the relevant assets
- Conduct a quick gap analysis
- Discuss fiscal implications
Within a few hours the group would see how real capital analysis informs budgeting.
