
Setting the scene
The country of Lilliput, after some deliberation, decided to introduce Universal Basic Income Guarantee (UBI). UBI is a payout to each person who is not working and controversial because:
- People think others should not get something for nothing.
- Other people think that the poor should not suffer.
- Some critics mean that there is no money to pay for it.
- Others say that it will free humans up from the stress of always having to be in a job.
- Some say people will quit their jobs and chaos will reign.
- Others will argue that employers will reduce wages for all.
The starting level of UBI and the speed at which it rises, tax levels on work, VAT, all are left up to the government to decide.
The game is based on simple principles:
- UBI is paid to all who are not in work – and the money comes from the social budget.
- Youth are paid 50% of the adult rate.
- We assume that companies can deliver at the same level even if employees leave.
Read the introduction to the UBI simulation here for more info.
Getting set up
Download the excel file here if you do not have it already, open it and go to the sheet called DECISIONS INPUT. The file should work in Google Sheets and in Libre but we have not fully tested that. Do let us know!
Setting up the game
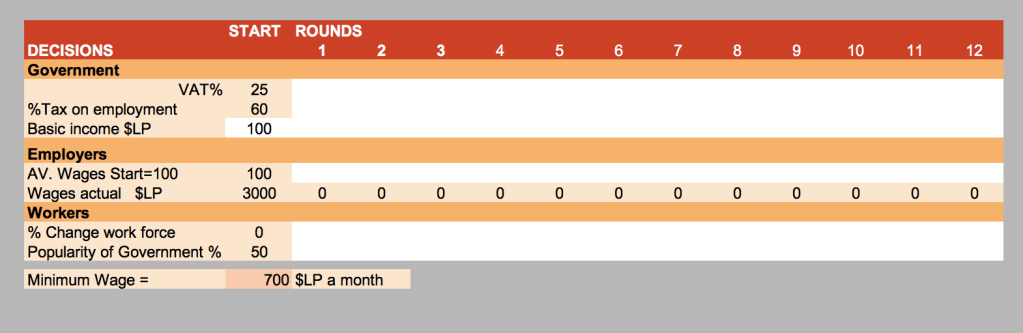
The game starts with the decisions input sheet, shown above. The white empty cells are open to add your scores. All other cells in the application are locked.
Each round ( at the top of the sheet, 1-12) requires decisions from different stakeholders. Assign stakeholder roles among players if you are more than one.
The roles and decisions are described below:
- The Government decides on levels of VAT. The starting level is 25% – you can change that from round one. Levels can be from 0 to 100% theoretically.
- The Government also decides on the level of taxation of wages. The starting point is 60% which represents employers tax and personal taxes.
- Finally, The Government needs to decide the monthly amount of UBI in $LP, Lilliput Dollars.
- Employers need to fill in the level of average wages. Starting level is 100, which you can raise or lower at each round. If you lower the wage to 95 then the wage will show as 95% of the starting wage 3000, which is 2850. If you lower the wage to 50% then the wage will be 1500.
- Workers decide if they are keeping their jobs or not. If they decide to go to UBI – for example if you have 10 players and one decides to quit then you enter “-10” in the square.
- Every one of the players is asked for their opinion of the politicians. Each one who feels they trust the politicians raises their hand. Enter the percentage of players who have trust. If you have five players and one has trust then the figure is 1/5 which is 25 out of 100. Enter 25 in the square.
The objective: How to win!!!!!!
The objective of the game is to have all five stakeholders end up in a better situation at the final round than the situation they started in. The more stakeholders that get a better score, the more points you get.
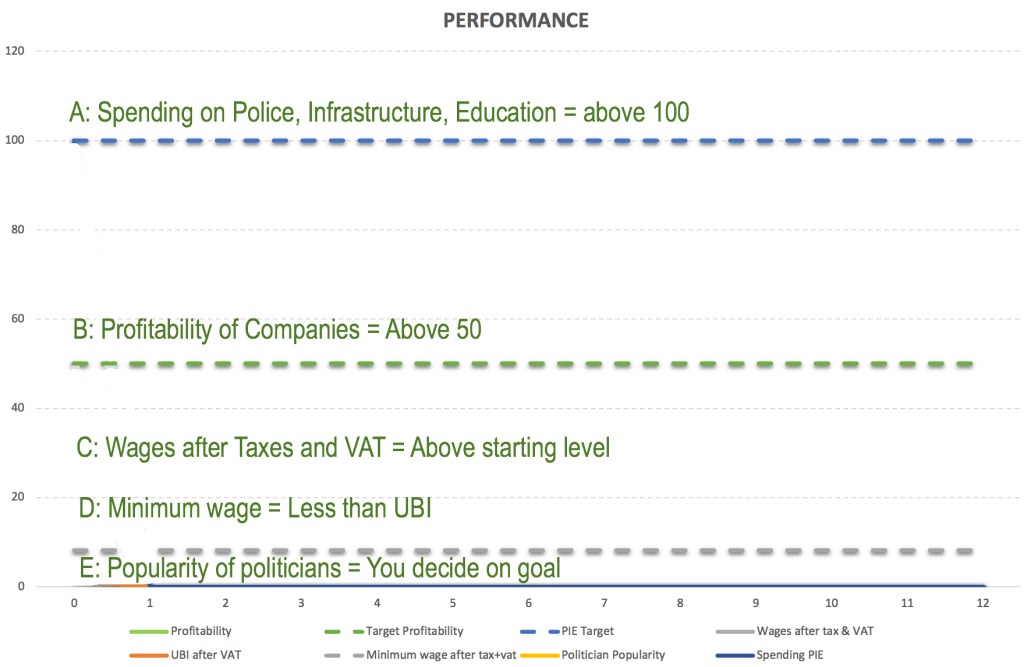
The graph above gives the objectives:
A) Retain government spending on the essentials (PIE= Police and judiciary, Infrastructure and Education. This means the population at large are well served.
B) Retain profitability of companies, above the starting mark of 50. Important for their contribution to the economy and supply of essential products and services.
C) Retain wages after taxes including VAT above the starting point. Important for workers to be able to afford essentials.
D) Moving UBI above minimum wage. This gives those without work enough to live on and drives up minimum wages.
E) Popularity of Politicians – players can decide on end goals.
First move
The first move is taken by the Government, for Round 0, where they decide on the starting level of UBI.
ROUND ONE
Round one starts with the Government decisions, one person can enter the figures into the appropriate squares.
After the government has made its decisions, the Employers decide on wages. Wages are calculated automatically in the square below.
Workers can then decide if they will stay in employment or leave to go onto UBI.
Finally all give their level of trust for politicians
Checking progress against goals
The progress graph shows performance of the economy up to the round. Four other graphs each present a more detailed view of what is happening in the economy

Chart 1
shows sources of state income and their relative sizes. These are affected by government income which is affected by taxes and size of wages.
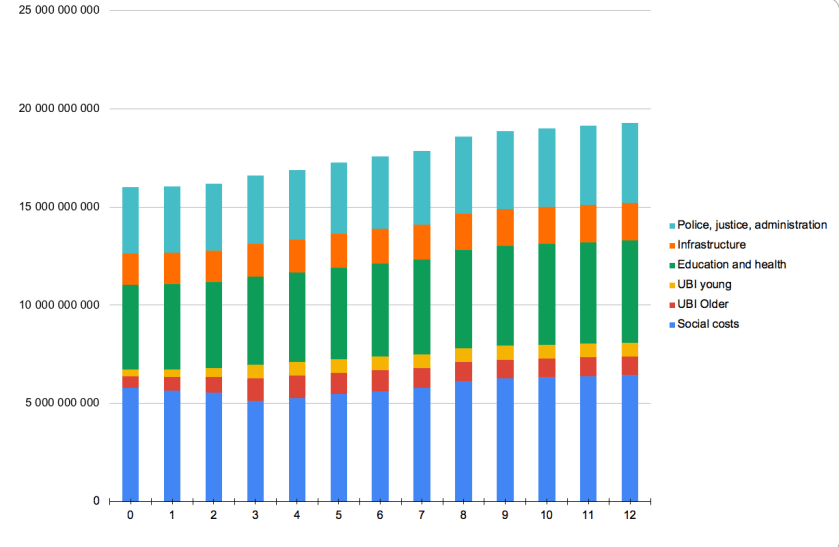
Chart 2
shows State Expenses. In this simulation UBI comes from the allocation to social care, and is shown as UBI for the youth (50% of adult amount) and UBI for adults.
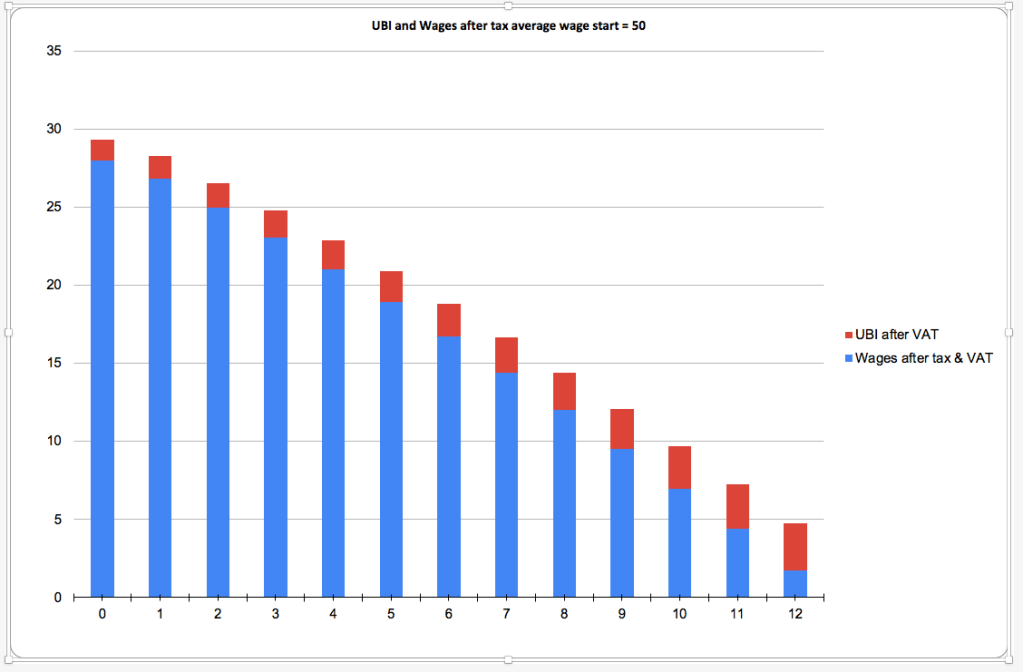
Chart 3
shows the relative amounts of money spent from wages and UBI after tax. These are affected by wages, taxation levels and the number in UBI.

Chart 4
shows the changes in numbers in work and in UBI. At the start the graph shows levels as per starting levels.

Chart 5
shows performance against the targets.
Following rounds 2-12
Following rounds are played in the same way as round one.
Ending the game
The game ends when all 12 rounds are complete or when all targets are reached.
Game variations
Learning about the economy as a whole. To learn a bit about the way a national economy works in a developed country study the table at the end of these instructions (BASIC FIGURES) explaining the starting figures. You will see the relative sizes and the amounts of money spent of main items. There are also some extra charts that show starting positions.
Exploring strategies: The team can try out various strategies to see how they impact the game as a whole. Here are a few to try:
- Austerity: this strategy reduces public spending by reducing levels of taxation
- Pushing wages down: this can be played out by employers reducing wages, or by government raising taxes to effectively give people less in their pockets.
- Generous UBI: this can be tried and financed by raising tax on work or VAT.
- Reducing the number of workers.
Other variations
Discussion. What is interesting about UBI is that it raises many questions about people’s understanding of how the economy works and their own assumptions about people’s behaviour. One variant is for a group to stop after each decision round and discuss the thinking behind their decisions before they study the performance graphs to see the effects of their decisions.
Learning. The simulation is crude in that it misses out many factors in the national economy. The game can be played in study circle format to explore questions that come up about they way the economy works. Members of the team can take on questions and the task of searching the internet and other sources in between meetings to report back and share their learnings with the rest of the team.
| BASIC FIGURES: Starting Point | Amount | Units | |
| Population | 10 | million | |
| Support quote older | 35 | per 100 in workforce | 1 988 636 |
| Suport quote younger 50% UBI | 41 | per 100 in workforce | 2 329 545 |
| In workforce | 100 of 176 | 5 681 818 | |
| Looking for work | 0,06 | % | |
| Over 20 | 8 | million | |
| Average wage | 3000 | $LP a month | |
| Minimum | 700 | $LP a month | 0,23 of average |
| VAT | 25 | % | |
| Income from VAT | 20% | total | |
| Gov. Income from work | 60 | % total | |
| Gov. Income other incl. capital | 20% | total | |
| Gov Income | 200 000 | $LP million | |
| Social expenses | 84 000 | $LP million | 0,42 of total |
| Government employees | 10 | % of total |
Please send feedback, ideas on improvements and any questions to the game authors. Contact us via the contact pages.
