
In this article we are going to demonstrate how the UBI works “under the hood” by looking at the underlying game logic.
The game makes some vast simplifications of how a national economy works – it is after all designed to be a learning experience rather than a mirror of how the world actually works.
The imaginary country, country, Lilliput, has 10 million inhabitants.
SUPPORT QUOTE
We use the concept of support quote. This is the ratio of people in work to people outside the workforce. To simplify matters we include everyone in the workforce of working age even if they can’t work or can’t find work.
In this case the quotas are:
- Young people under 20: 41 per 100 in workforce
- People over 65: 35 per 100 in workforce
GOVERNMENT EXPENDITURE AND INCOME
We make some simplifications here in that income = expenditure. In Lilliput the expenses for social care are 42% the rest is divided among:
- Police, justice and administration
- Infrastructure
- Education and health
The graph engine produces a graph showing the expenditure over time (rounds):
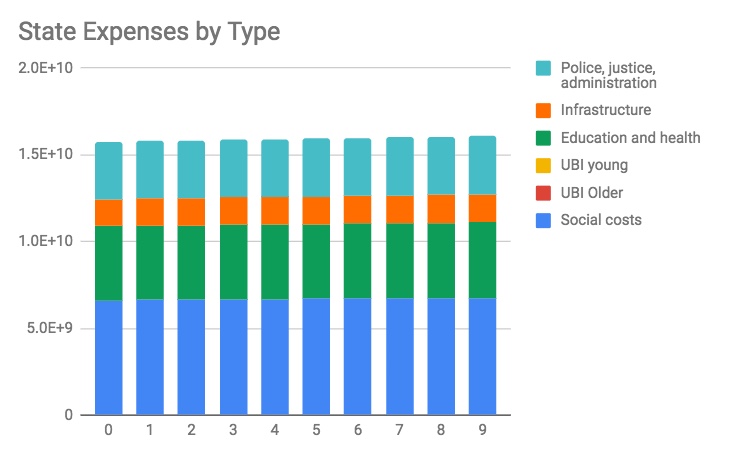
UBI comes out of social costs as the logic of the game rests on the supposition that there is little room to take UBI from essential services. The graph below was generated based on UBI increasing from 50% of subsistence level by 10% per round ending up about 50% of the average wage.
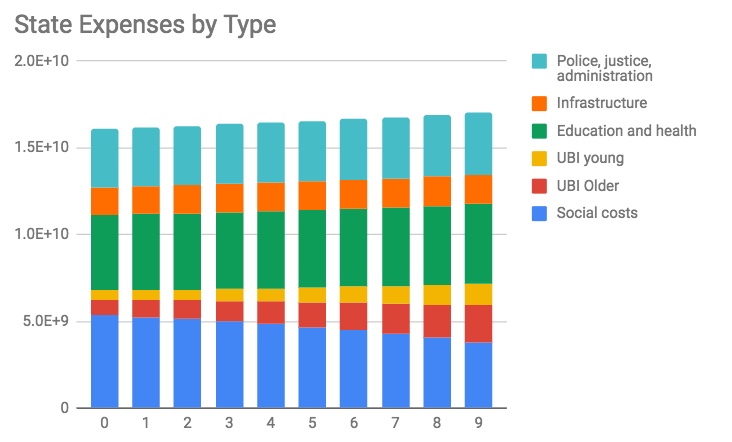
You will notice that State income increases when UBI is paid out. This is because the simulation takes into account that VAT is collected from UBI-takers spending their income.
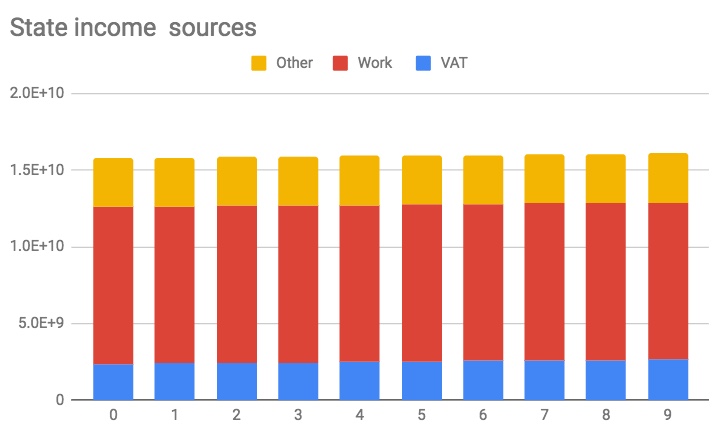
State income comes from three sources: VAT, tax on work (see below for a more detailed explanation) and “Other”. Other includes tax on capital. In our scenario other remains at 20% whilst players can decide on tax on work and VAT. The engine produces graphs like the one below. The example comes from a test run where VAT is raised slightly, and all other taxes remain at the same level.
Wages and Taxes
Another vast simplification is wages and taxes. In our fictive country we use the Swedish model where of the total wage costs, 30% go to employer’s tax, 30% go to municipal and state taxes and 40% is left to spend.
We use Lilliput dollars as a unit of accounting, very roughly one dollar is one Euro. So the average wage is $L 3000 a month and the subsistence level is $L 1000. We also assume a normal wage distribution curve, which is not the case in developed economies but it simplifies calculations.
Of the 40% left to spend after taxes, 25% of that goes to VAT. The graph engine produces several “views” of what is going on, here is one below:
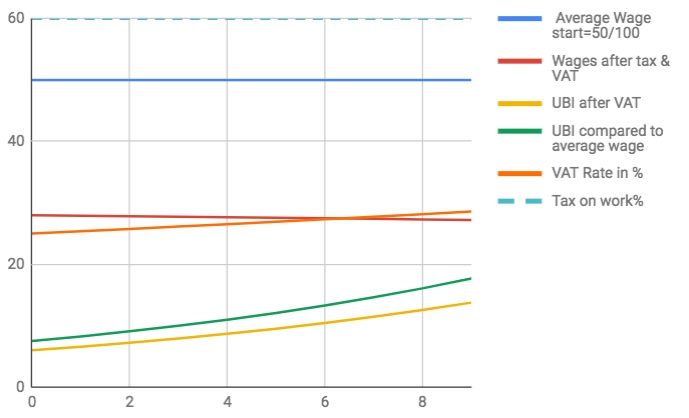
To demonstrate how decisions in the game show up in the graph engine, wages are given a start position of 50, and UBI and the minimum wage are plotted accordingly. VAT here is 25% at the start, raised at subsequent rounds, as is UBI. UBI after VAT and Wages after UBI are compared in this way.
If you or your organisation would like to take part in a UBI simulation, please contact us via the CONTACT page.
Read more about our UBI simulation here.
Further articles on UBI
