

Circular economy thinking is taking hold among policy makers, civil servants and scientists alike. For example, the Swedish Government formed its own Circular Economy Delegation last year and recently announced its national strategy for the Circular Economy. Facing reduced material availability and rapidly reducing use of fossil fuels to align with the Paris accord, Sweden hopes that its production system will continue to deliver and indeed grow economically, but with far less material and fossil energy intensity. This article explores some of the theoretical and practical challenges of measuring what matters in order to help frame policy and effectively pursue strategy.
Liberal economies seek to change via exhorting corporations to go circular
Many countries are like Sweden in the way it is governed. Government dictates laws and policy, but it is regions, counties and local authorities who carry practical responsibility. It does not stop there. The real responsibility is farmed out to companies. Like all liberal democracies, Governments work to entice, goad and coerce these private companies that make up the main part of society’s product apparatus to do as policy intends.
Our production system responds extremely slowly to what matters
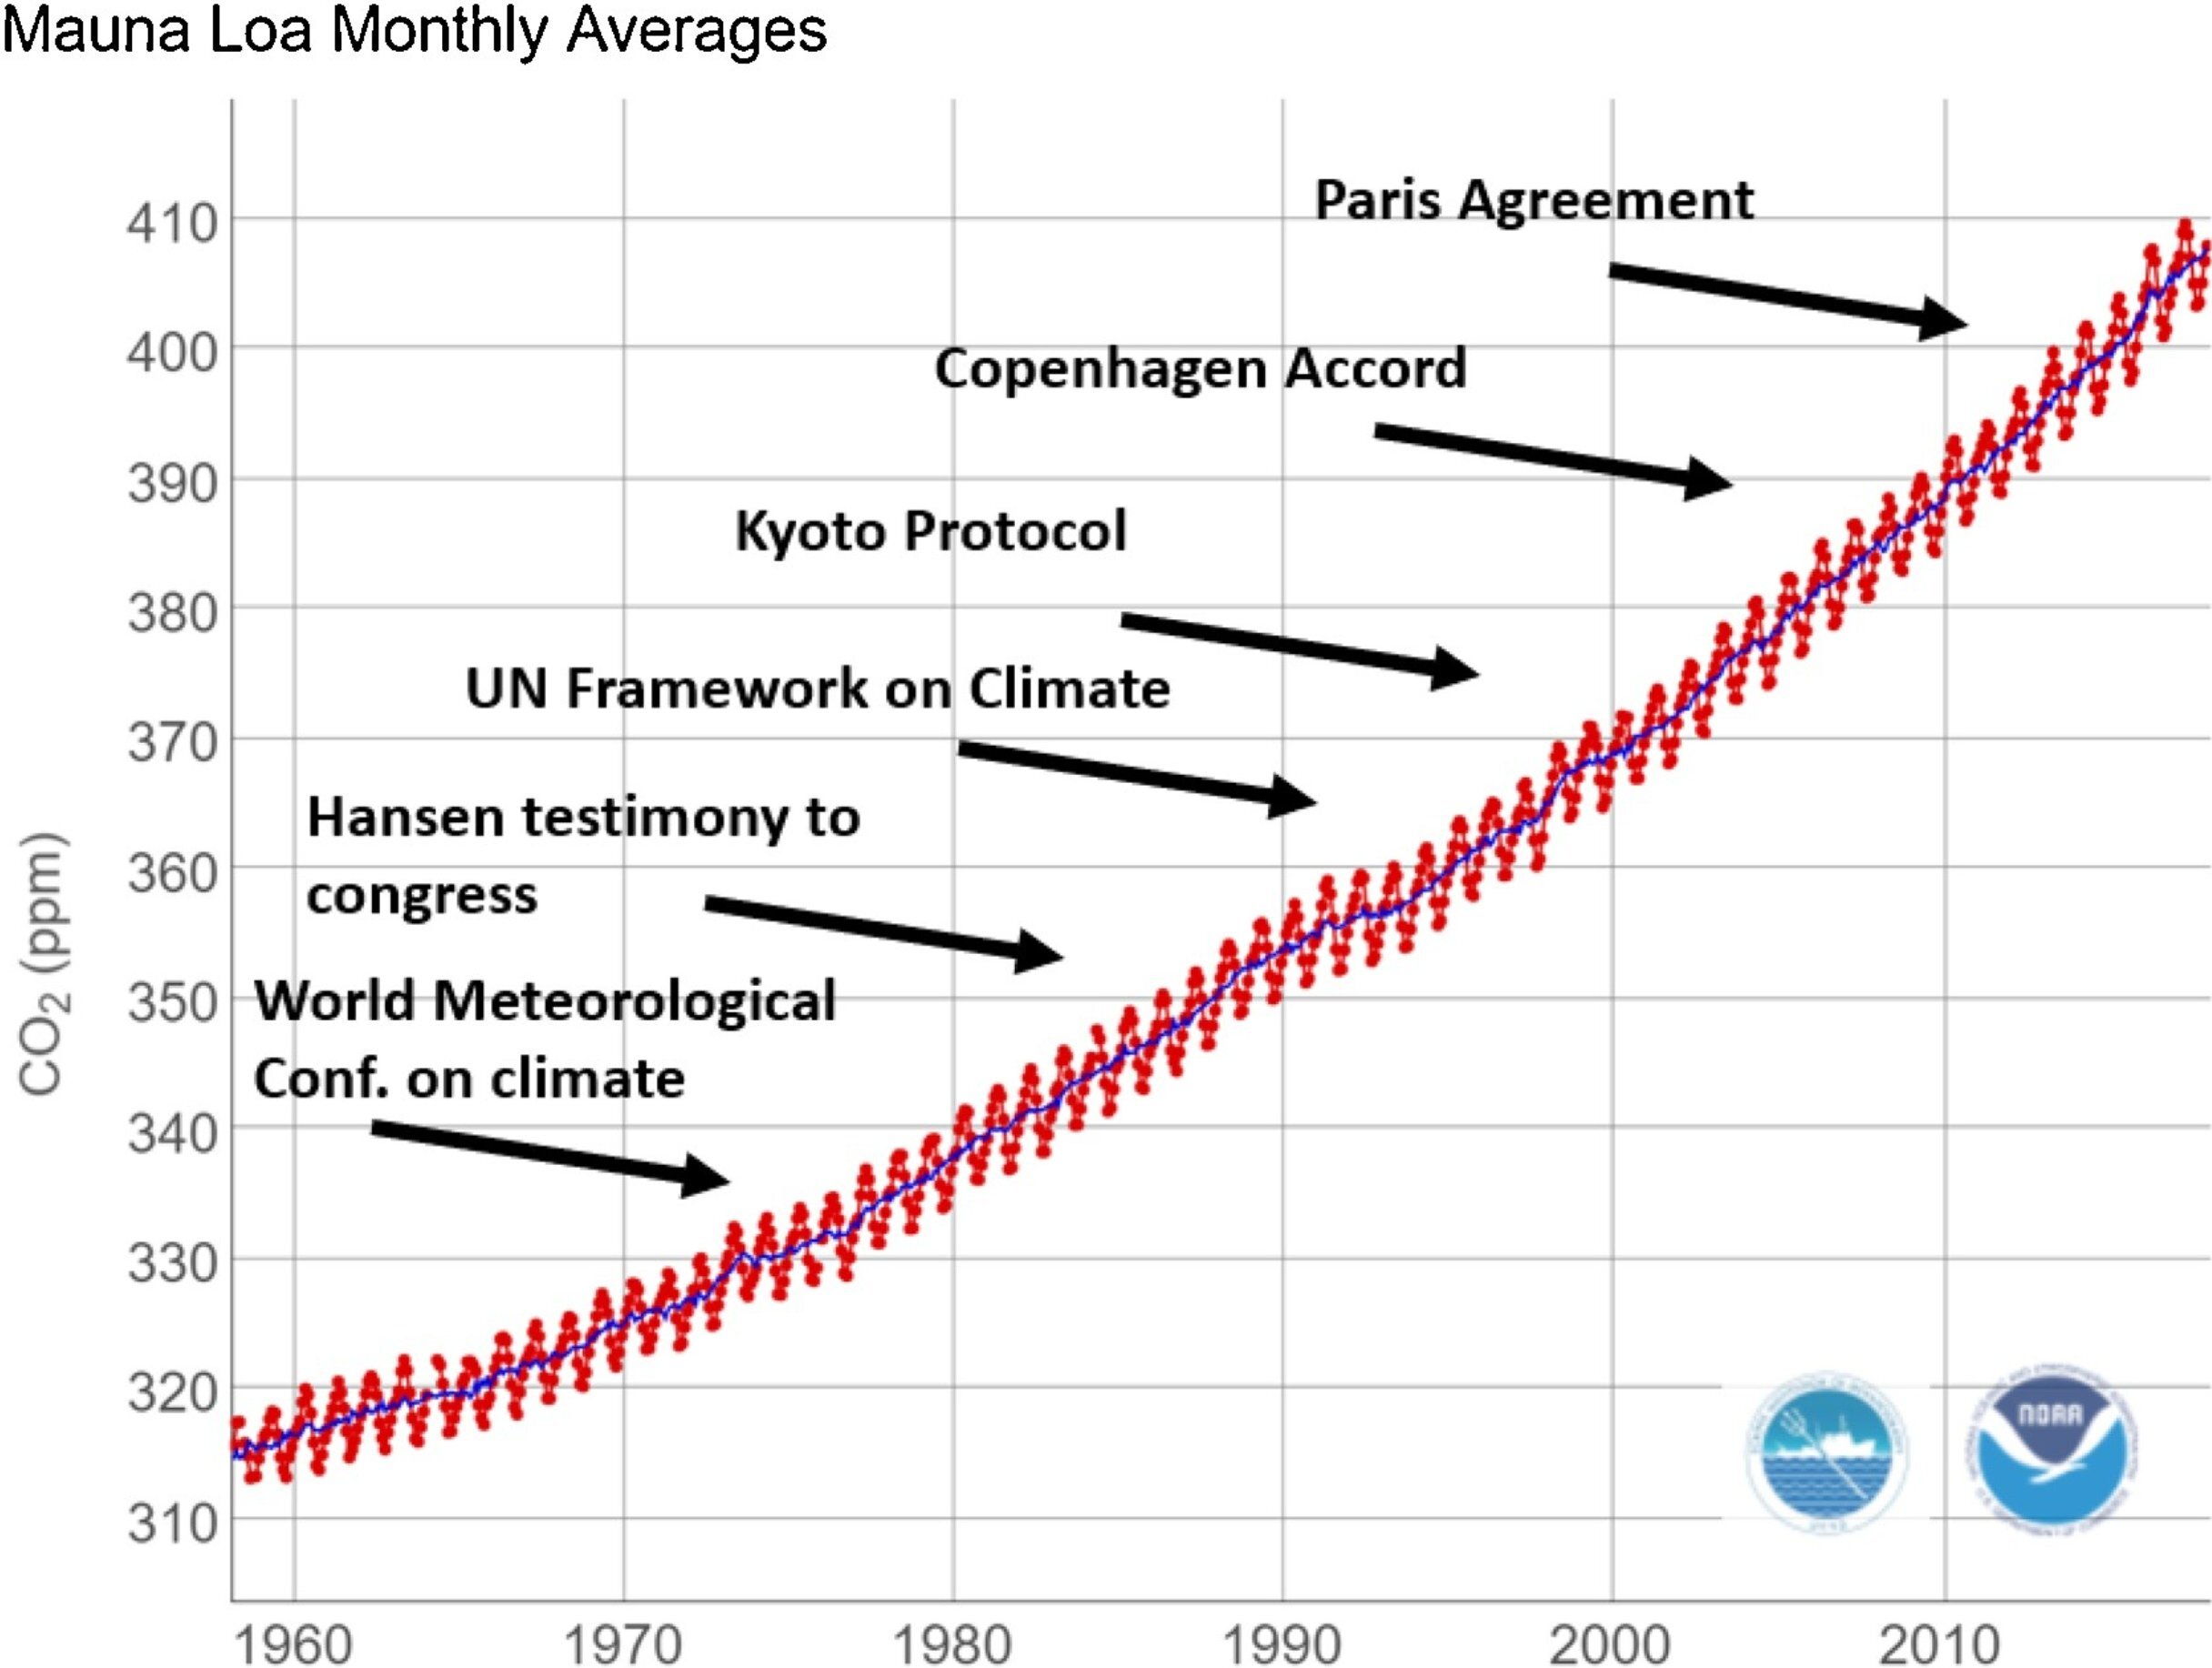
The production system is extremely slow in responding to concerns. In particular, current overall climate performance of the production system is extremely poor. Since serious concerns were raised over climate impacts in 1988, carbon dioxide levels have risen from 348 to over 417ppm. As the diagram below shows, even as warnings and resolve has hardened, emissions have continued to rise. Material use also gives cause for concern. Key materials are depleting, prompting the EU list of 30 critical raw materials.
Pinning hopes on the circular economy to solve multiple challenges
Like many other administrations, the Swedish government hopes that by introducing the circular economy – indeed finding ways to stimulate companies to “go circular” – it can address serious concerns with material supply, environment and climate together. This might be hard to manage as there are few monitoring mechanisms in place that can bring insight into progress toward circularity or even if circularity is bringing the desired effects.
The mechanisms in place to track progress towards circular economy are insufficient
Current measuring of what matters in the circular economy is likely to fall short. For example, basic business accounting laws do not require firms to declare how much energy is embedded per product/service or the material embedded in the product directly or indirectly. Laws require even less a declaration of the total energy and material embedded in a service along the whole supply chain, from material extraction to recycling. One company might “go circular” only to find that others in their supply chain are releasing more carbon dioxide and negatively affecting the environment. The diagram below might help explain.

Consider this schematic above of a typical supply chain. The diagram shows energy flows in blue lines, products as arrows in green, and business to business flows of tools and machines (infrastructure) as the red lines.
Each step in the supply chain typically involves inputs of materials and energy, outputs of materials to the next step, and finally waste /recycling.
The diagram below shows the firm structure in more detail.
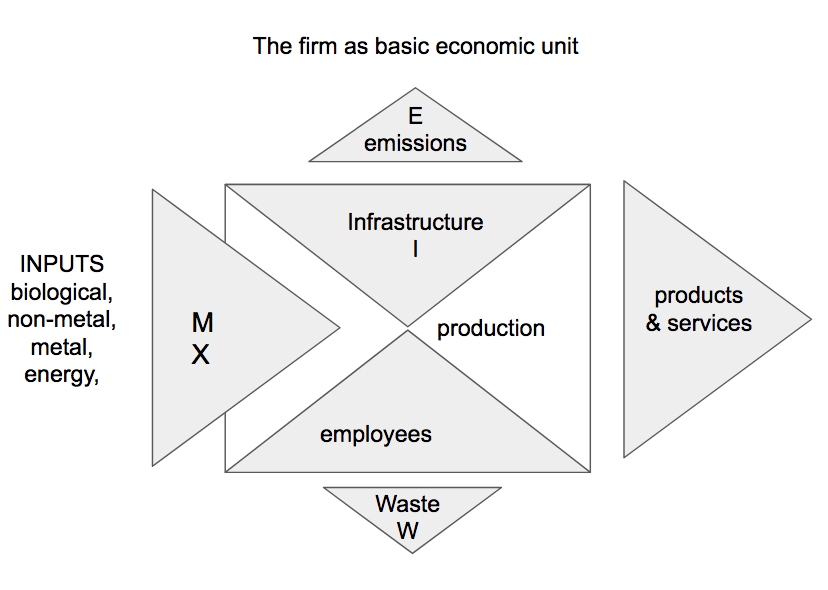
The four basic parts of the firm’s production apparatus are:
- Inputs (M)
- Energy (X)
- Employees
- Infrastructure (all machines and equipment) (I)
- Products
- Customers
Other outputs are typically
- Emissions of CO2 to air (E)
- Waste ( W)
To understand the impact of any product or service you need to look at the whole supply chain
One way to visualize product impact is its material footprint. One could imagine the size of footprint could be related to the number of kgs of material that the purchase of product entails. These are so to speak embedded in the product. Embedded is the term that describes the accumulated kgs of material (of fuel, carbon dioxide produced, waste generated etc,) along the supply chain.
When looked at as a whole, the energy embedded in the product is actually all the energy needed to produce it from extraction to recycling/waste. Similarly, the embedded material is all the material involved from extraction to recycling.
For each of the seven steps, then, emissions from the embedded energy and all materials involved need to be summed up:
Total material involved = M1 +M2 +M3+M4+M5+M6+M7
Total emissions as CO2 from energy involved =X1+X2+X3+X4+X5+X6+X7
This calculation does not take into account the material and energy needed to manufacture the equipment, buildings and machinery needed by the firms at each step. You can however calculate the total mass of the infrastructure involved.
Total built infrastructure involved = I1+I2+I3+I4+I5+I6+I7
Footprints visualise the material burden of product provision
Taken together, for the total number of products sold and in use per year, this would represent the material footprint. It might even be possible to estimate the footprint for each individual product in terms of CO2 and material. Indeed, the footprint would provide a figure in kgs of carbon dioxide plus material. The important thing, however, is to focus on the significance of whole supply-chain thinking.

A simple thought experiment might help illustrate this thinking. Let us concentrate on one calculation: the mass of carbon dioxide emitted by private cars. The amount of CO2 is dependent on fuel economy. More liters per 100km gives higher emissions.
Example: the CO2 footprint of the passenger car
CONTEXT: we are given to understand that a certain vehicle does 100km on 9 litres of fuel. However, purchase of that fuel and the car itself entail emissions too from combustion of the oil used to make fuel.
| Stated fuel economy | 9.0l/10km |
| Fuel is hauled to the filling station by truck. The truck might use 10 litres for every 1000 it delivers. So we need to add 1% | 9.09l/10km |
| Fuel needs to be refined from oil, and that might take some 10% of the total, equivalent to fuel. | 9.999l/10km |
| To manufacture a car, it is estimated it combusts the same amount of oil as the car uses in its lifetime. | 19.99l/10km |
| The oil needed for all of this needs to be extracted. Today it takes About one barrel to raise 8 barrels of oil. So you need to add 1 to every 8 units used | 22.5l/10km |
The final figure gives us an energy footprint that is 2.5 times larger the normally stated figure for environmental impact of passenger cars.
Footprints are useful but not enough
Does the footprint approach go far enough in giving a decision basis for policy though? Footprint is more a way of comparing products, rather than looking at overall system functioning. Instead of debating the many variants of footprint calculations we should cast our net wider.
For the circular economy you need to think in terms of real capital
Another way to measure what matters is to take as a starting point the concept of the circular economy as one of actually not using up material at all, only passing it from one stock to another. In other words, the circular economy is one of stock and flow. Real capital is the term used for things that are used in the production process but not used up. The diagram below illustrates the concept.
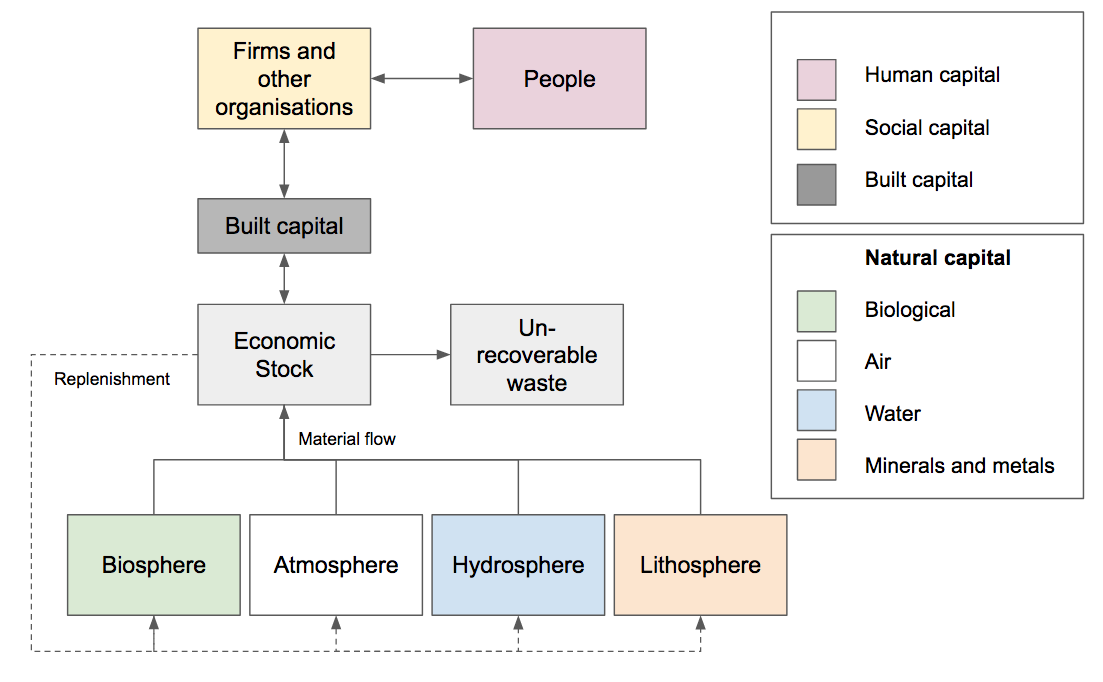
Materials flow from natural capital through the built capital of firms (firms are social capital) to provide products and services to people (human capital) who in turn are provided their labour to the firms. From being in use in the production system, the material flows back to natural capital stocks.
The table below gives further explanation of the different types of real capital.

Everything is used, nothing is consumed, only cycled.
In some models, use of biological materials for food, fuel and fibre is seen as consumption as the food is turned into waste, the fuels are burned and fibres – clothes and building materials all have a limited life-time. If you see however these biological materials as merely components – rather like Lego bricks that are used to build models, broken down to individual bricks and then built up again- you see that these building blocks – some scholars call them nutrients – are used time and time again.
Circular economy needs from – to – and back thinking
In this way the biological capital in the circular economy can be described in the form of from to and back. The diagram below contrasts linear thinking (from-to) with circular thinking (from-to -and back)

The real capital approach, rather than just concentrating on the material and energy embedded in the product, allows us to analyse the effect of the production cycle on real capital as well.
The diagram below illustrates this connection between real capital use and service/product provision. Metrics could be formulated to quantify both the impact of extraction and replenishment on the status of natural capital and the performance levels of the service and their effect on people.

In a functioning circular economy, material use takes place without degrading these multiple forms of capital. It might even increase them. All whilst providing service at acceptable levels.
How to measure the effect of any product /service provision, circular or linear, on the multi-capitals?
Coming back to the question of how to measure what matters it would seem reasonable, then, to measure the effects of any particular production system on the different real capitals. But how?
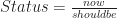
Stating a measurement, for it to be useful, needs to be done in context. Much sustainability reporting is presented in the form of “reduction of emissions by 10%” or “uses less energy”. Truly useful measurements are those that present what is against what should be. This is describe in the literature as the normative approach. See for example this paper from the UN Research Institute for Social Development.
Science can provide clarity without moralising: if you want x then you should y.
Now, sustainable means remaining or keeping. In this case we are talking about keeping real capital. Science can offer a normative approach where the narrative takes the form…
If you want to keep (xyz) then (abc) should be…
Measurements can be developed thus:
Science can formulate “shoulds” as ceilings and floors
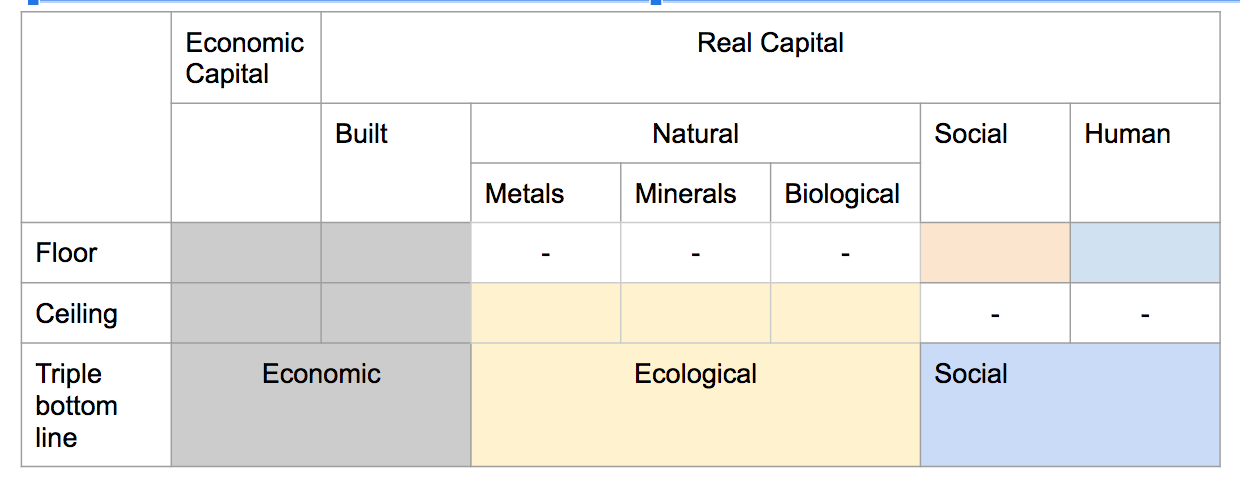
The doughnut approach, developed by economist Kate Raworth, suggests that the impact our production activities have on natural capital should remain within scientifically determined limits, both for how we extract and harvest, but also how we handle stocks and replenishment. Raworth describes natural capital limits as ceilings, building on the work of the Stockholm resilience center which identifies planetary boundaries for human activities. Social and human capital limits are floors. Here, performance of the production system must ensures no citizen is forced to endure a situation at the level of, or worse than, the floor. Hunger, homelessness, vulnerability to physical violence are examples of social “floors”.
If you want to keep natural capital xyz then you should not exceed ceiling abc.
A normative approach to doughnut metrics
If you want to keep human capital xyz then you should not go below floor abc
The multi-capital approach brought together with triple bottom line
Several researchers include economic capital as real capital. Indeed, the triple bottom line approach puts built capital in the same category as financial capital. There can be some logic in doing this: before the firm can start trading or indeed producing, it needs to have purchased or otherwise acquired the machines and equipment needed. This requires a sum of money often coming from the owners at start-up. In this way, the money is not used up, rather the owners will get it back (hopefully) when they sell their shares. A summary table below shows how these all these concepts hang together.
One use of this approach could be to analyse the effect on the multi-capitals a particular supply chain is having. The analysis should throw up areas of particular negative impact and possibly show possibilities to remedy where the supply chain is depleting capital.
For individual organisations, the MultiCapital Scorecard for organisations has been developed by Martin P. Thomas and Mark W. McElroy as a tool for performance reporting.
Applying this approach to the circular economy, you could analyse the effect on each of the capitals exerted by particular supply chain. The analysis should throw up areas of particular negative impact and concern and possibly show possibilities to remedy it by increasing or remedying circularity. Indeed, employing a multi-capital approach can throw light on where improving one area will improve others to, leading to the creation of a positive spiral effect. For example, addressing hunger releases creativity and can set off a wave of entrepreneurship which in turn can lead to increases in employment and overall prosperity.
The simplified example below illustrates how authorities could start to map where services to citizens had the most negative and positive effects.

The table above illustrates how the multi-capital approach can be applied to stimulating circularity. For each service, the status of each capital is evaluated from a circular business approach. Minus means measured against the normative value of a floor for the social and human capital, and ceiling for natural capital, the status of the capital is insufficient. 0 means neither better nor worse and + means capital is being regenerated. Double minus or double plus show maximum intensity of effect.
Built capital is especially interesting: can it provide services in a circular way? Can it use recycled material, run on renewable energy and produce wast that is recyclable? There is also the question as to if the capacity of the installed built capital is enough for everyone’s needs.
The approach above is still at overview level, it might guide overall strategy or policy makers may need to dig down deeper into details to identify strategic options.
Trying the method out: the automobile
We took the example above of the supply chain for personal mobility that can be the source of carbon dioxide emissions several times larger than those stated by manufacturers. Let us pursue the example, again with a rough rule of thumb approach for simplicity to aid clarification, to see what policy implications that might arise and to explore the question of measuring what matters in this case. The table below gives examples of how a multi-capital analysis can proceed.

Following the analysis there needs to be a clear normative narrative developed for the change towards circularity:
If you want to keep private car climate gas emissions from destabilising the climate you should phase them out quickly according to the Paris Accord.
This calls for a phase out-plan. Let us make one up for 2040. Let us base it on vehicle kms travelled as emissions are roughly the same if there are one or two or even more in a vehicle. A plan like the one illustrated below:

We can imagine a 20% drop in demand for private transport – that would require us to say work from home one day a week or shop a little less often.
A little harder but not impossible is to increase ride-sharing. But we would not have to share every ride. We are looking at something like one in four. Finally, we need to phase out fossil fuel cars by swapping them for electric. With the measures above we only need to swap 40%. All this has to happen at a steady pace over 20 years.
For each year there will be a normative figure, the trajectory needed to reach the final target. Each year changes could be measured as follows. All results at 1 or over are good.
| Vehicle kms | Demand reduction | Rideshare increase | Electric vehicle swap |
| Total for year Maximum | Reductions Minimum trajectory | Increases Minimum trajectory | Swaps Minimum number of swaps |
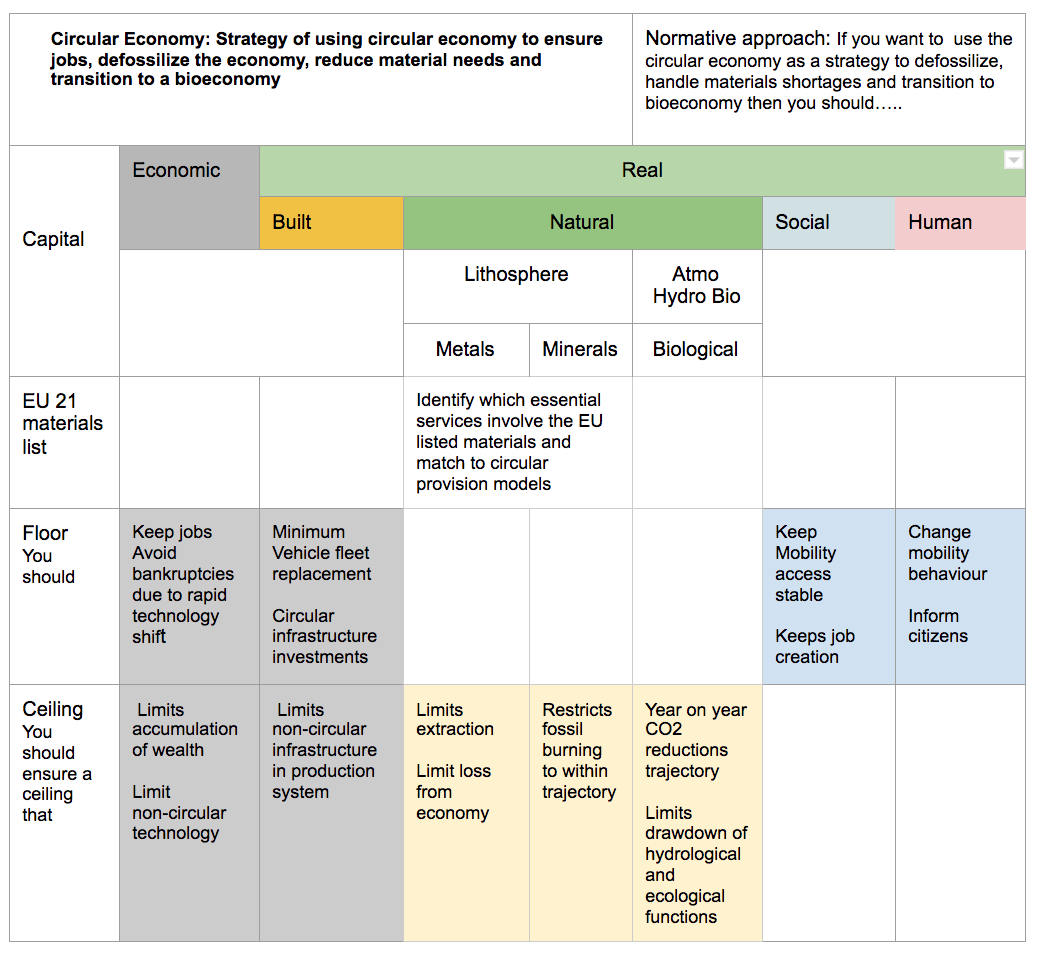
Measuring progress on the objectives of the circular economy
We opened this discussion by identifying several important aims of going circular:
- Reducing material intensity in services to handle material shortages
- Less material transport is a strategy for reducing CO2 emissions
- Transition to the bio-economy
- Green jobs from the bio-economy
The multi-capital analysis below shows a first high-level attempt to identify priorities for a circular economy that has these aims. The lists is not complete but could provide a fruitful path to explore. Identifying metrics and ensuing these match with the Sustainable Development Goals is also further work needed.
Advantages of multi-capital approaches to circularity
A multi-capital impact approach to the circularity of supply chains has several advantages:
Measures against “should be” show progress in context and improves transparency towards stakeholders. These measures give clear indications to policy makers as to how on track the changes are.
For each identified capital type, identifying capital preservation or regeneration status sheds light on investment needs as well as behaviour changes needed.
The overview provided by multi-capital approach has the ability to be a powerful informer of strategy. Strategy formation needs to know where to focus, and to either look to start to do or do more or do less or stop altogether. The normative approach can result in powerful indicators for policy makers to monitor and adjust as needed.
Offering an overview of all capital types ensures that policy makers take a broad approach and do not miss vital aspects of the service provision. The overview may offer insights into positive spiral opportunities.
Alignment with accepted metrics. Multi-capital approaches combine triple bottom line with planetary boundary as well as doughnut social floor thinking.
The normative approach generates metrics that better speak to citizens and are easier for journalists to communicate. This ensures a deeper social engagement in the transitions.
Multi-capital approaches are a robust way to deal with adaptive systems like the production system. For the enormous changes that are facing us, and for the hopes we place on corporations that have shown sluggishness up to now, normative metrics will quickly show if the incentives in place for companies are working. If they are not working, the insights of the multi-capital analyses will form a sound basis for introducing market-based instruments that will augment the information work of spreading the ideas of circular economy with incentives that will make it rather expensive NOT to comply.
Circular economy needs fiscal reform
The economic system is probably not geared to circularity. This is the time for governments to show leadership in clarifying what the circular economy can do for humanity and working to introduce the fiscal and financial reforms needed to get the investment flowing to where it is needed. Increasing the cost of fossil fuels by levying surcharges that get paid back to each citizen, like the carbon Dividend introduced in Canada is one example. The idea of a basic job guarantee and Basic Income could help drive the transition too. Science can be extremely helpful in developing the framework needed to guide that leadership. Multi-Capital methodologies bring a systemic approach to this work.

2 thoughts on “Multi capital scoring: how to measure what matters in the circular economy”