
A recent post outlined a system map of the industrial society. One reason to map things out is to give you helicopter perspective where you might be able to better see where the system is not working. This post takes on one of the obvious reasons the industrial society is still not on track for the Paris agreement: the car.
But first let us return to the system map: 11 entities, 31 flows and 3 types of flow.
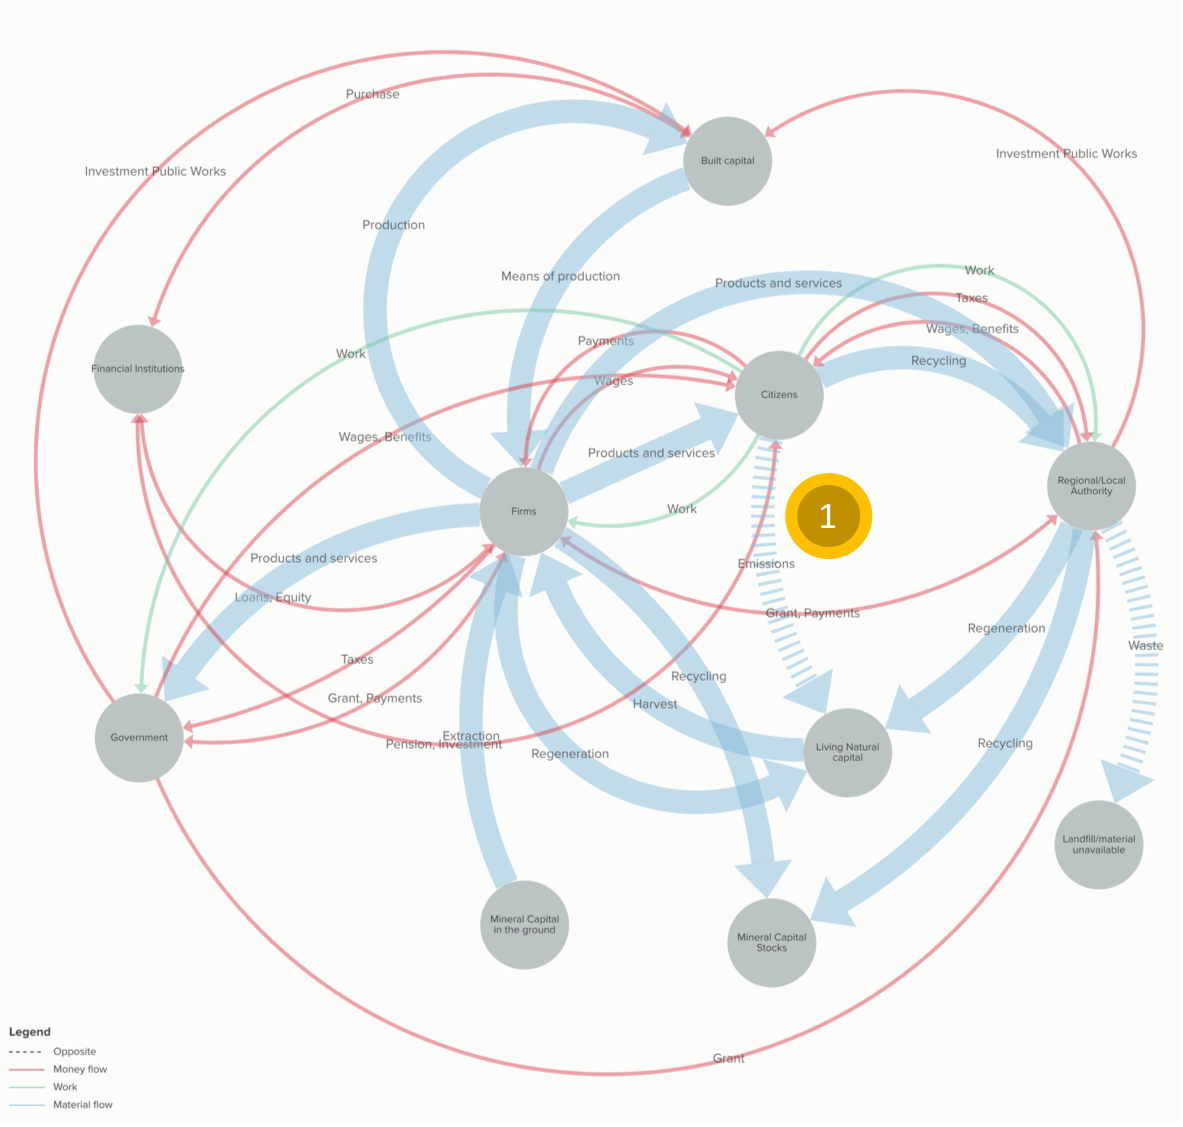
The diagram above shows the flow in context. It is the only major emission of material into the environment and to natural systems by citizens, The rest goes via waste handling and in our scheme is designated “recycling”. It is waste when the waste company cannot resell it.
Let’s take a closer look:
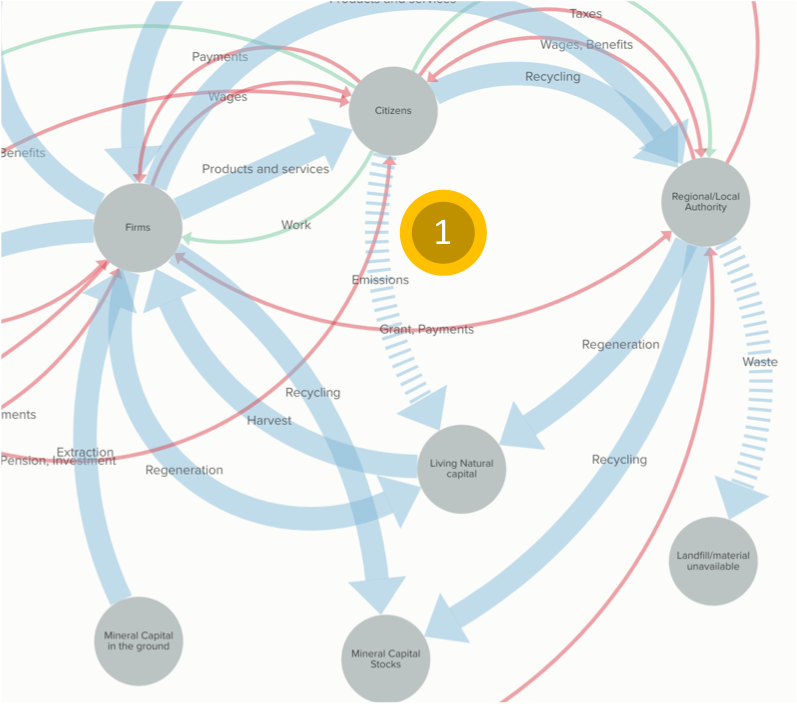
Now. Many may be thinking that this cannot be right. That private car emissions are not so large in the big scheme of things. Consider a moment, then, that it is burning fossil fuels that adds extra carbon to the atmosphere Where are the fossil fuels burnt? The diagram below gives the answer.

You can see from the above that it is the transport sector where most crude oil products are used. The transport sector comprises all road vehicles, commercial and private. However, statistics from the Swedish Statistics Agency reveal that CO2 emissions from transport are 63% from private vehicles.
From statistics to policy: choosing constraints
Next question: what are the available constraints that will stimulate/restrict the use of private cars?
Here is a policy “goodies list”
- Grants for electric cars
- City planning to reduce private transport needs
- Banning private ICE cars
- Grants for lift-sharing
- Raise taxes on fuel (use a tax and dividend scheme so it is fair)
- Information campaigns
- Increasing public transport
- Subsidising maxi-taxis
Making the wedges work
Let’s bake all of the above into some kind of policy plan. And let’s include ramping up carbon uptake by natural means and doing stuff with our infrastructure to defossilize it. Taken together it might look like this, with each colour representing the reduction in emissions from each constraint.
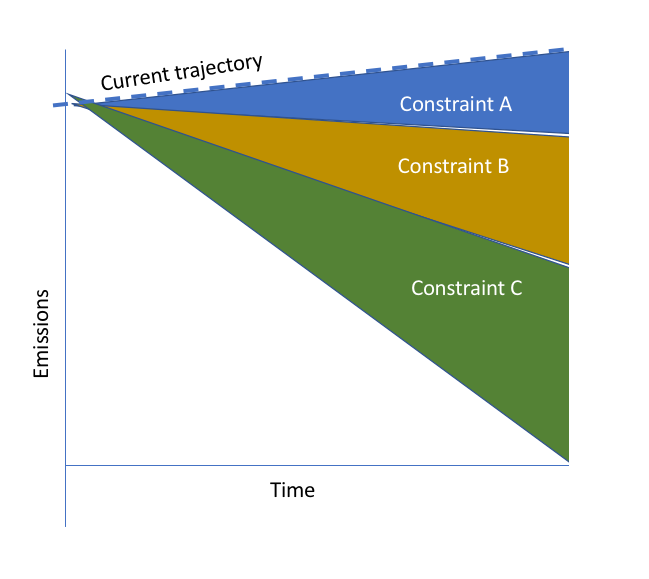
It is not hard to envisage the policy combinations needed. The political gumption to introduce them is another question.
The earlier post on this topic referred to a normative approach of communicating with politicans.
- If we VALUE (X )
- Then we need to SUSTAIN ( Function Y)
- This is dependent on retaining or regenerating STATUS of (Natural system, Economic System, Infrastructure, social provisioning) to (normative level of Z )
STATUS = How it is/How it Should be to retain that we value
To achieve this, the system needs constraints. Options are evaluated against the value (X). If no constraints are in place, this will negatively affect value sustain (Y).
If we value a stable climate then we need to rapidly curtail ICE private car use.
Status of transport emissions from private cars = 63/0
Likely effects in a five year window (Made-up examples based on my understanding of the Swedish situation)
- Banning ICE cars 0/0
- Grants for electric cars 40/0
- Tax and dividend 50/0
- etc.

One thought on “Industrial system disconnect #1. The car”