
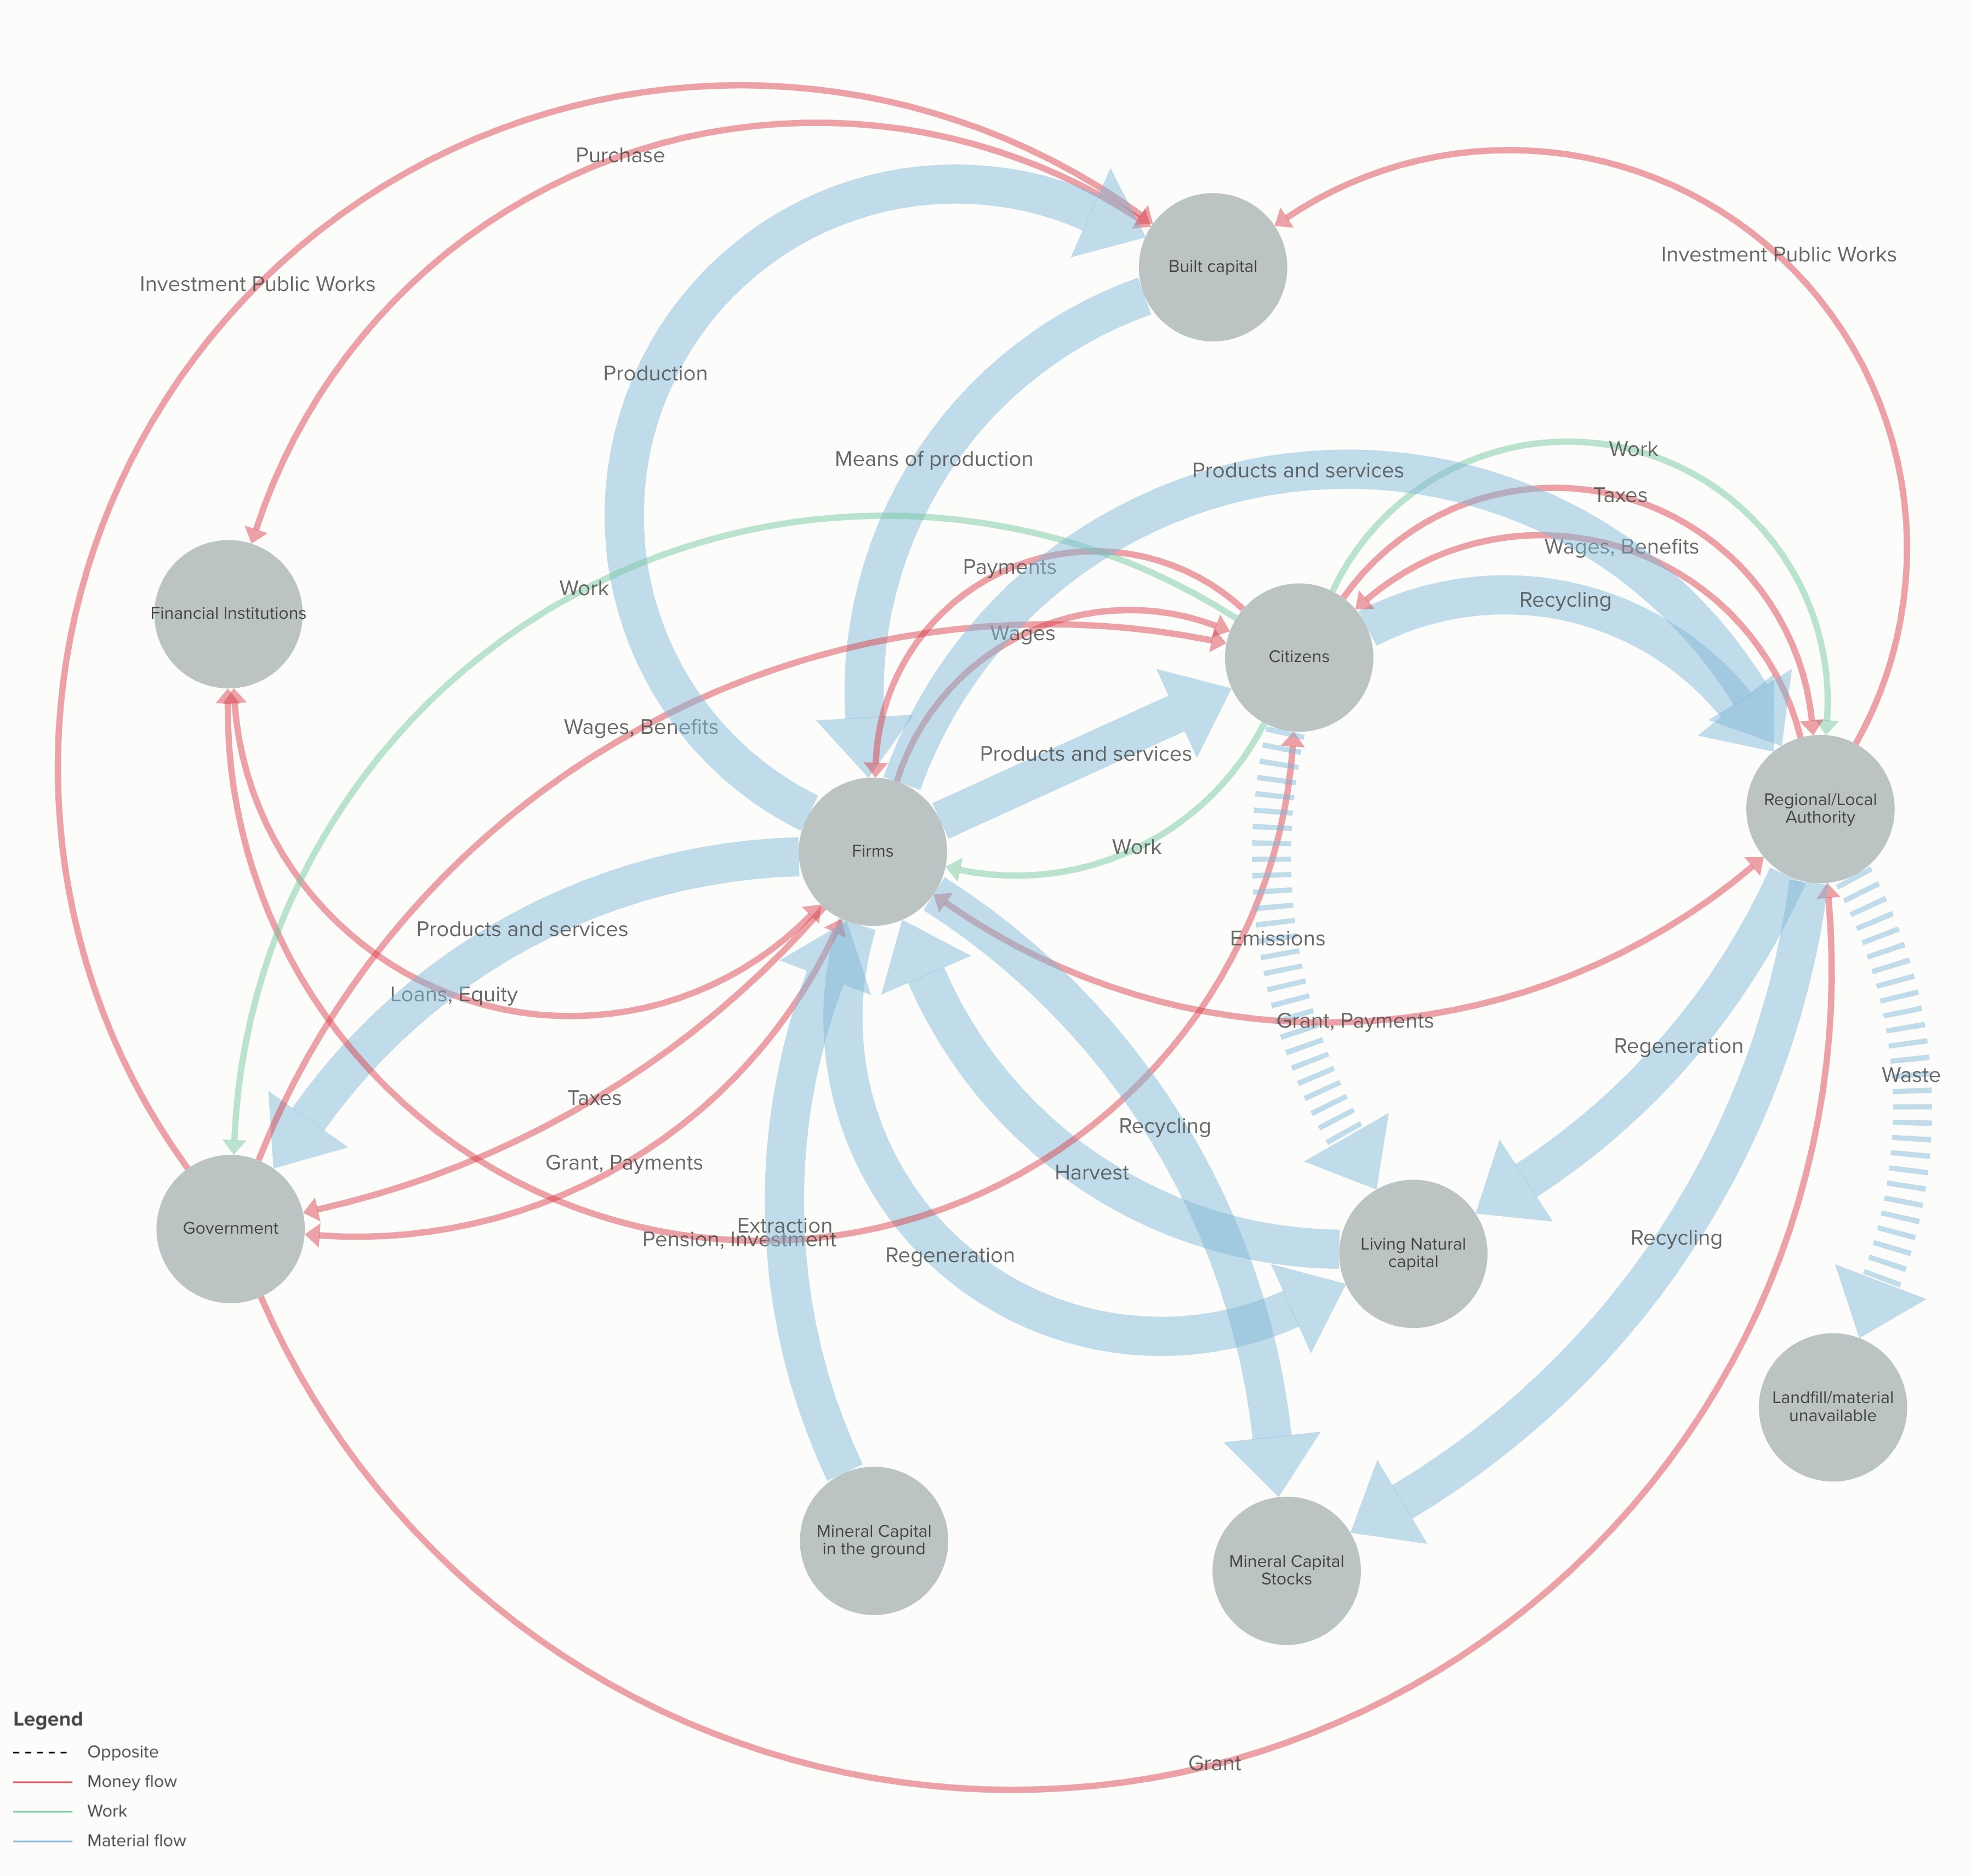
Above is the latest version of my system map, done in KUMU.IO.
The basic elements of the map
- 11 elements (e.g. government, natural capital stocks, built capital, etc)
- 31 connections (e.g. flow of resources to firms, waste to local authority)
- 3 types of flow: work, money, resources
Why map like this?
A map of how things are working today helps thinking. You might see unexpected connections, you might see your assumptions and challenge them, and you might be able to see disconnects, where things are going wrong.
My purpose in doing the map was to see if it was obvious where investment needs to go to truly form a new green deal.
What do I see?
- Most waste is handled by waste firms and municipalities. The only instance where citizens pollute directly is by driving internal combustion, ICE, vehicles. And this is the close on the largest single source of fossil-CO2 emissions in Sweden.
- Local and regional authorities, as waste handlers, hold the key to the circular economy in their hands. All material deemed waste falls under their jurisdiction.
- The biggest infrastructure investors are public authorities and firms. A new green deal must encompass money being put into building green solutions. Much infrastructure drives non-circularity. For instance, if you invest in a ICE car you will have to use it.
- You have to ask yourself why any firm would invest in non-environmental technology. There must be some kind of rule-book governing the functioning of the system.
- The informal economy – where citizens are not wither owning forms or working in firms, or government owned firms – is not represented other than in car driving.
- If citizens never bought pollution driving products they would cease to exist.
- At each of these 31 flows there are economic, regulatory and cultural factors driving the behaviour of each actor in the system. If we are to correct system poor performance we could start to look at that ecosystem.
- Systems often have two or three intervention points that change the whole system. I am staring at the map trying to see where to intervene. Ideas anyone?
Constraints are missing
Systems go into disorder – and reach tipping points – when there is nothing stopping them. And perform badly when there is no enabler to help them. Systems thinkers categorise these enablers and barriers under the broad term constraint. A constraint is something that controls the way a system performs by keeping it within certain limits. Constraints are also enabling, their existence can promote system health too.
The necessary constraints that should have been in place to stop our way of life causing climate chaos were not in place. And they are still not in place. Indeed, the talk of constraints gets lost in arguments about targets and causes.
And a normative approach
A normative approach offers a metrics format that is both informative and rational when entering into a narrative that involves values.
Normative metrics format:
Metric = Status, what is /What should be
Politicians tend to claim What Should Be is their area as it involves subjective judgement. What Should Be implies values beyond metrics. Values is an area often claimed by economists too – for example a good’s contribution to GDP measured in money.
Normative measurements can, though, be framed in the narrative of sustainability. Another term for sustain is keep, and metrics can be presented by scientists in the format:
If you want to keep X, then activity Z (extraction/emissions etc.) should (remain below Y).
Measuring current status would then take the pattern:
Metric = Z, What is/ Y, What it should be to keep X
Constraint options need to be formulated and analysed in the four dimensions of sustainability: Infrastructure, natural systems, societal performance and economic system. Language can use the pattern of:
- If we VALUE (X )
- Then we need to SUSTAIN ( Function Y)
- This is dependent on retaining or regenerating STATUS of (Natural system, Economic System, Infrastructure, social provisioning) to (normative level of Z )
To achieve this, the system needs constraints. Options are evaluated against the value (X). If no constraints are in place, this will negatively affect value sustain (Y).
To learn more about constraints see my earlier post here, and look up the work of Dave Snowden.
The next post starts to explore the areas where constraints can rapidly change the behaviour of the system. We start with citizens’ direct emissions to the natural world.

5 thoughts on “Industrial society system map”