
Most national budgets tell us how much money governments plan to spend and collect. But they rarely say anything about whether the nation’s forests are thriving, its infrastructure is decaying, or whether citizens are healthy and capable of sustaining the next generation’s wellbeing.
In other words, the budget tracks the money — but not the real foundations of value that the money is meant to mobilize.
That missing link is what the Real Capital Framework was created to address.
Real Capital refers to what is used but not used up in fulfilling human needs and societal values. It includes four interdependent forms:
- Natural capital – the living systems and materials that support all production and life
- Built capital – the physical infrastructure we rely on, from housing to transport
- Human capital – the knowledge, health, and capacity of people
- Social capital – the networks and institutions that allow cooperation and trust
Together, these make up the actual wealth of a nation. Yet in most fiscal debates, only one dimension — money — is tracked and reported.
To see what’s missing, imagine two countries:
- In Country A, GDP is rising, but soil fertility, worker health, and social trust are all declining.
- In Country B, spending appears high, yet the forests are regrowing, children are learning, and the railways run on time.
Which nation is truly becoming richer?
The real side of a national budget
When most people hear “national budget,” they imagine tables of income and expenses — taxes in, spending out. But behind every line item lies real activity involving real resources.
A government can allocate funds to schools, but whether children actually learn depends on the condition of the real capital involved: healthy teachers, well-maintained buildings, and supportive communities.
Money is just the signal. Real capital is the substance, the means of production that is used but not used up.
Every budget decision draws on — and changes — these underlying stocks:

So, for every financial flow we record, there is a real flow: the use and renewal (or depletion) of these capitals.
A robust national budget should therefore ask two questions at once:
- How much money is circulating?
- How is the nation’s real capacity to provide for needs and values changing?
In system dynamics language, each type of capital is a stock — a reservoir of function and potential. These stocks can rise or fall depending on how we use them.
Some examples:
- When forests are clear-felled faster than they regrow, natural capital declines.
- When railways are maintained and upgraded, built capital strengthens.
- When children are fed well and taught well, human capital grows.
Tracking these shifts gives a fuller picture of national health — a kind of “triple balance sheet” where financial, real, and social dimensions are visible together.

Table above, an overall sketch of how real capital fits in to the triple bottom line
This is where the Real Capital Framework begins to change the logic of budgeting: from managing money to managing capability.
When national budgets include only financial flows, they miss this deeper reality. The Real Capital Framework brings those invisible foundations into view — showing not just how much we spend, but how our collective wealth of functioning systems is changing.
Understanding real capital as a stock and flow

To work with real capital, it helps to think in the language of systems dynamics — the study of how things change over time.
In this view, every form of real capital is a stock — a kind of reservoir that holds capacity.
Unlike a warehouse filled with goods, these stocks represent function: the ability of forests to store carbon, of railways to move people, of citizens to work and learn.
These stocks rise and fall depending on the flows going in and out:
- Positive flows build or maintain capacity — like restoring wetlands, training workers, or repairing bridges.
- Negative flows draw capacity down — like overfishing, burnout, or neglecting maintenance.
In other words, every action in the economy either strengthens or weakens the nation’s ability to meet its needs.
Let’s look at a few examples:
- Clear-felling a forest may generate short-term income but reduces its long-term ability to store carbon, host biodiversity, and regulate water — a loss of natural capital function.
- Regular railway maintenance may seem like a cost, but it actually preserves the performance of built capital.
- Feeding children healthy meals at school improves their learning and health — an investment in human capital that compounds over decades.
If we reviewed a nation’s past budgets through this lens, we’d see not just where the money went but how each expenditure affected the condition of the real capital base — for better or worse.
This also highlights a key point:
Modern Monetary Theory (MMT) reminds us that a nation doesn’t need to balance spending and income in purely financial terms. What it must balance, however, is the functionality of its real capital — because that’s what actually limits or enables prosperity.
Thus, the question for future budgeting becomes:
Are our collective assets — natural, built, human, and social — gaining or losing the capacity to provide for what we need and value?
That’s the true meaning of sustainable finance.
How to follow up a budget
A yearly national budget tells us what was spent and earned — but it doesn’t tell us whether the country’s real capacity improved or declined.
Imagine instead a “real capital follow-up” alongside the financial report: a record of how each type of capital changed over the year.
- Did forests recover or degrade?
- Did infrastructure improve or decay?
- Are people healthier, better educated, and more capable?
- Has trust in institutions strengthened or eroded?
This kind of review shifts attention from how much was spent to what the spending achieved in real terms.
From money flows to real changes
Every monetary outlay affects some part of real capital.
- Education budgets influence human capital.
- Transport investments shape built capital.
- Environmental measures impact natural capital.
- Public service reforms affect social capital.
A Real Capital follow-up would track these effects as changes in status — showing whether each capital type became stronger, weaker, or stayed stable.
A simple visual could show this at a glance:
- Green for improvement, red for decline, yellow for no change.
- Arrows to show whether the trend is getting better or worse.
For example, a fictional country’s real capital dashboard might look like this:
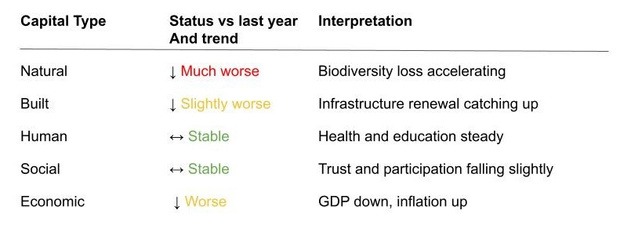
This kind of table would make the national situation instantly visible — a triple bottom line in action, where the real, social, and financial dimensions are evaluated together.
It would also create accountability over time.
If natural capital keeps trending downward while built capital improves, policymakers would have to explain why — and what trade-offs were made.
Why this matters
Tracking the status and trends of real capital turns budgeting into a living feedback system.
It helps nations learn whether their policies are strengthening the foundations of wellbeing or quietly undermining them.
That, in essence, is the art and science of budgeting beyond money — managing not just the flow of currency, but the functioning capacity of a nation.
The concept of capital maturity helps plan measures
To make real capital practical for budgeting, we need a way to describe its state of development — not just whether it’s improving or declining, but how far it is from its full potential.
That’s where the idea of capital maturity comes in.
- Every form of real capital — natural, built, human, and social — can be thought of as evolving through stages of maturity.
- When a capital is immature, it lacks the functions or capacity to meet the nation’s needs and values.
- When it reaches maturity, it has developed those functions to a level that supports both wellbeing and resilience.
For example:
- A young forest has not yet developed its full range of ecosystem functions — water regulation, habitat diversity, carbon storage — so its natural capital maturity is low.
- A transport network with modern rails, electric trains, and renewable energy sources is closer to built capital maturity.
- A population with strong education, good health, and civic participation represents mature human and social capital.
The key is that maturity is not just a physical measure — it reflects capability: the ability of that capital to contribute to the values and needs society has agreed upon.
Maturity as a policy guide
Once maturity levels are mapped, they become powerful for planning. In the illustrative graph below, 100 represents maturity, the blue part is status now, and the red is the gap.

Suppose a nation’s analysis shows:
- Natural capital at 60% maturity (forests and soils under pressure)
- Human capital at 70% (education and health improving but uneven)
- Built capital at 85% (infrastructure mostly sound but ageing)
- Social capital at 50% (trust and cohesion low)
These figures immediately reveal where attention is needed.
A country aiming to transition to electric transport, for instance, may discover that it lacks sufficient minerals — showing a maturity gap in material capital that calls for investment, recycling systems, or trade adjustments.
Or a nation facing labour shortages may find its human capital maturity lagging, suggesting the need for education, health, or immigration measures.
From data to dialogue
Capital maturity also helps shift the political conversation. Instead of debating only how much money to spend, citizens and policymakers can ask:
“What is the current maturity of our essential capitals — and what would it take to reach the level needed for our values and goals?”
In this way, capital maturity provides both a metric and a narrative — a way to talk about national progress that connects economics with ecology, wellbeing, and long-term viability.
Can we drill down to actionable and investable measures?
Once a nation begins to see its wealth in terms of real capital, the next question is obvious:
Can we measure it clearly enough to guide investment and action?
The answer is yes — if we start simple.
Think of capital maturity as a dashboard with indicators for each essential function of society. Each indicator has three reference points:
- A normative level — what “maturity” looks like when that capital fully supports societal needs and values.
- A floor — the minimum acceptable level before wellbeing or functionality starts to break down.
- The current status — where we actually stand today.
The goal isn’t to reach perfection, but to ensure every form of capital remains above the floor and moves steadily toward its normative level.
Example 1: Housing capacity
Take the number of dwellings in a country.
If the average household is 2.2 people, then roughly one dwelling per 2.2 citizens could be set as the normative level of maturity for built capital in housing.
If there are significantly fewer dwellings, that signals undercapacity — a gap that constrains social stability and wellbeing.
But even when total housing stock looks adequate, distribution matters: some families may have multiple homes while others have none.
So a secondary measure might track equitable access to dwellings — showing how allocation, not just quantity, affects real capital performance.
Example 2: Agricultural land
A similar logic applies to food systems.
A maturity metric might estimate how much productive land is needed to feed the population sustainably.
For instance, if between 0.19 and 0.5 hectares per person is required, a country can compare its actual farmland per capita to that range.
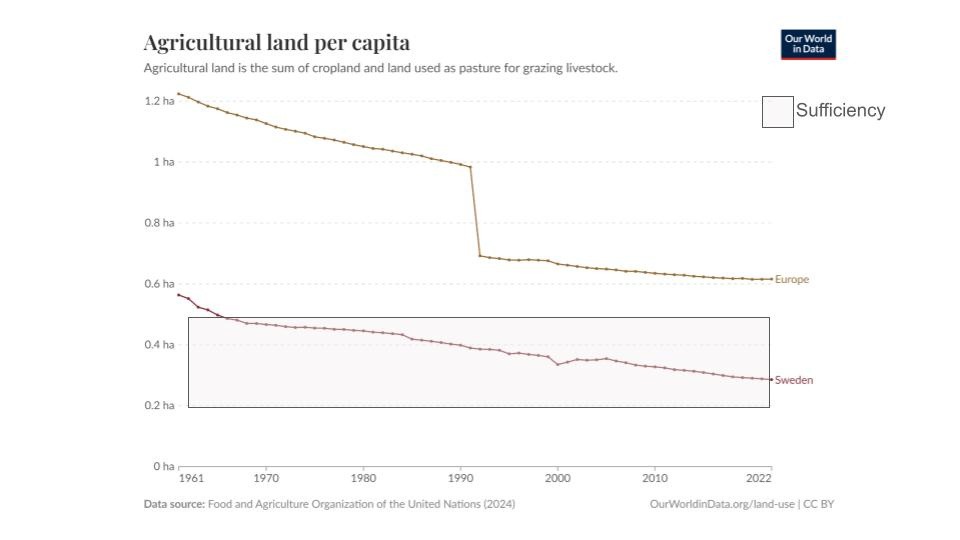
If land area per person is shrinking — as has been the case in parts of Europe — it indicates declining natural capital maturity, even if agricultural output appears stable.
That trend should inform future budgeting decisions about soil regeneration, import dependence, or dietary patterns.
Example 3: Industrial capacity for circularity
We can also apply this reasoning to industry.
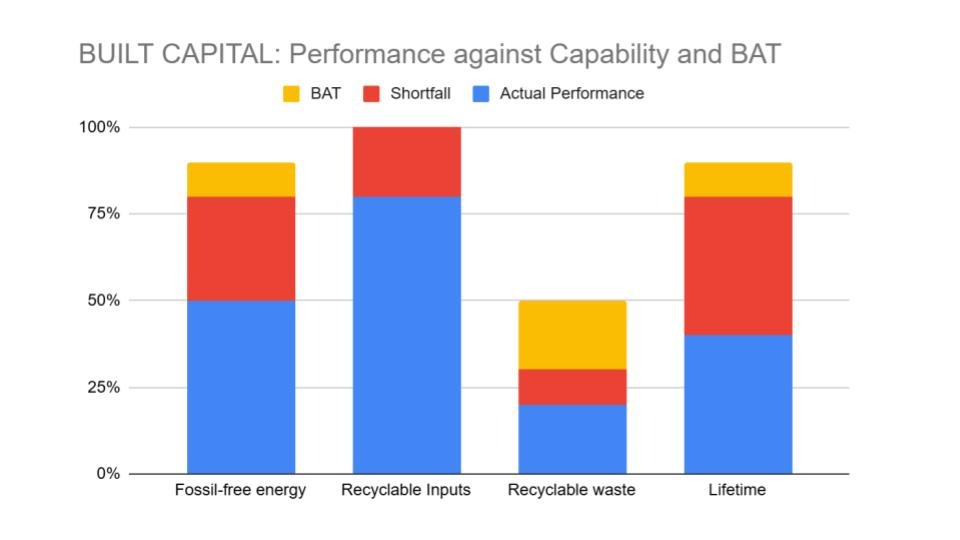
Suppose we assess a manufacturing sector’s ability to use recyclable materials and produce recyclable outputs.
If best available technology (BAT) allows for 80% recyclability but the current industry only achieves 50%, then there’s a clear maturity gap.
For this, again illustrative, example, we are looking at the capability of an industry’s installed base to function with circularity. 100 represents the capital maturity, the normative level required. This is how to interpret the diagram: the blue area represents actual performance, and the red the capability. As you see, the industry can use recyclable inputs, even though it does not to the full extent. The yellow area represents BAT – best available technology. In this case, even with BAT the industry is unable to produce recyclable waste.
Here, policy can differentiate:
- If technology already exists, industries should invest in upgrading.
- If it doesn’t, the nation should fund research and innovation.
Why this matters
Using capital maturity as a guide turns abstract sustainability goals into investable actions.
It shows not just where money should go, but why — because each investment directly builds the capacity of the real capital that underpins national wellbeing.
Over time, this approach could make the national budget resemble a strategic maintenance and development plan for the nation itself — tracking not only financial stability, but the evolving health of the systems that make prosperity possible.
What about industry?
Industry plays a special role in the Real Capital Framework — it sits at the intersection of built, natural, and human capital. It uses materials from nature, infrastructure for production, and human knowledge to create goods and services.
That means its maturity can be a strong indicator of how well the economy as a whole is functioning within planetary and social limits.
Let’s take an example.
Suppose we look at an industry’s installed base — the machinery, facilities, and technologies it uses — and ask a simple question:
“To what extent is this base capable of operating in a circular economy?”
We might find that:
- The current performance (shown in blue) uses some recyclable materials but far from all.
- The potential capability (in red) shows that, technically, the system could handle more recyclable inputs if policies or incentives improved.
- The best available technology (BAT) (in yellow) reveals what’s possible today with top-level innovation.
When performance lags behind potential, the task is clear: invest in upgrading.
When even BAT falls short of national goals, the signal is different: invest in research and development to expand what’s technologically possible.
In both cases, the maturity metric guides intelligent policy rather than reactive spending.
It helps decision-makers see whether the problem lies in adoption, technology, or governance — and act accordingly.
The beauty of the Real Capital approach
The strength of this framework is its simplicity. It asks just one essential question:
Is the state of our real capital sufficient to provide for our needs and values — now and into the future?
Answering that question requires both numbers and judgment, both science and philosophy. But once we begin to measure maturity and trends, budgeting becomes a tool for collective learning rather than a ritual of financial arithmetic.
The Real Capital Framework brings the invisible foundations of prosperity — people, ecosystems, infrastructure, and institutions — into view.
It helps a nation see itself as a living system and manage its renewal deliberately, not accidentally.
What do you think?
If your country’s budget were expanded to include real capital — its forests, schools, communities, and industries —
which form of capital do you think most needs renewal?
And what would be the first measure you’d propose to strengthen it?
Share your thoughts in the comments below — I’d love to hear how you see the next evolution of national budgeting.
